Discontinued because I will be working on this data for my master thesis. I’ll try to post updates on that though.
Recently the German government required all most fuel stations to report their prices to a central agency to control price fixing and enable the public to inform themselves. Right now the project is in a test phase. Unfortunately the data is not publicly shared with anyone but a selected few companies. The Telekom Tankstellen website is one resulting frontend to the data. But since the display options and graphical representation did not satisfy me, I just had to make my own map(s). Most importantly I wanted to see the variety of prices in the whole country at once.
In a short series of posts (maybe just two or three) I will show you how to acquire the data from the website, how to get it into a GIS usable format, how to make a map with it and maybe how to automate all of it with the goal of turning it into an animation. Let’s start with the data acquisition.
Scraping data
Prerequisites
- A web browser that let’s you inspect network traffic. I use Opera 12, it has very nice developer tools. You could also use ngrep, tcpdump, wireshark or something similar but I find a web browser most convenient.
- curl or wget
- Bash or some other way of automating curl/wget
- Some basic understanding of HTTP
Inspecting the website
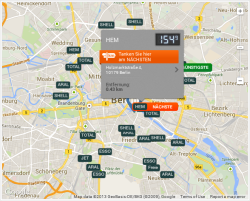
The Telekom Tankstellen website offers a search function where you can choose a type of fuel and a radius of up to 20 kilometers around a location in which you want it to return all fuel stations. There is an embedded map which shows the results with big brand labels while highlighting the nearest as well as the cheapest station in the area. When hovering the mouse pointer on the labels, the price is shown in a pop-up. Below the map is a list of all the affected stations, their brand, address and price.
Since the map is just an embedded dynamic Google map with custom markers you might already suspect that the raw coordinates of the stations are available to your web browser. Also note how the page does not reload if you make a new search, a great indicator for Ajax.
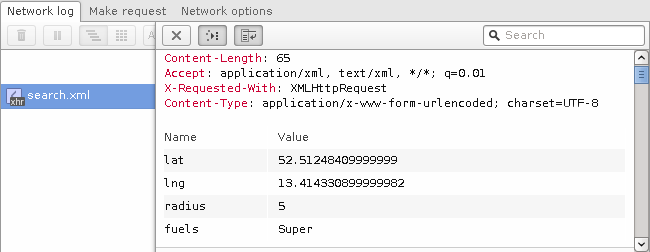
Enable your browser’s network monitor and reload the website. Now look through the list of requests. (In Opera you can easily filter by resource type, in this case you could filter for XHR.) You should see a file called search.xml. Inspect the details of that request.
As you can see in the image above, the request is a HTTP POST to /api/v1/search.xml with the parameters lat, lng, radius and fuels.
The server’s response is an XML object showing you a multitude of information about the fuel stations:
<search>
  <gasStations type="Array">
    <gasStation
    ident="519b492fbed7139bf0d432c0"
    brand="HEM"
    name="Hem Berlin Holzmarktstraße"
    street="Holzmarktstraße 4"
    zip="10179"
    city="Berlin"
    lat="52.5147271"
    lng="13.4195317"
    highway="false"
    services="convenience_store,grocery_store"
    distance="0.431"
    is_open="true"
    >
  <openingTimes type="Array">
    (...)
  </openingTimes>
  <fuels type="Array">
    <fuel
    kind="Super"
    price="1.539"
    timestamp="1381593720">
    </fuel>
  </fuels>
</gasStation>
(...)
Excellent, we found the data source. If you were only interested in those selected few stations, you could just copy’n’paste the XML response but since our goal is to make a map of the whole country we need to be able to automate this data acquisition step for arbitrary coordinates.
With curl you can perform the request like this:
curl --data 'lat=52.5125&lng=13.4143&radius=5&fuels=super' http://tanken.t-online.de/api/v1/search.xml
By default curl will print the response to the terminal but you can tell it to save it to a file or alternatively just use wget instead.
I first tried if you could use a bigger radius than the 20 kilometers available on the website and yes, the maximum seems to be 50 kilometers. I also tried to find a way to make it return prices for all the fuel types but did not succeed. I could imagine that it would work if you pass them in a properly formatted array but poking around like that takes it too far in my opinion.
Performing a mass-scrape
Mass-scraping can be taxing to a service and is ethically questionable, so I will not share a snippet to copy and paste. If you decide to do it yourself, you will have to implement it yourself.
We can now download fuel stations within a radius of 50 kilometers around an arbitrary coordinate. So of course we can do that for many coordinates until we have complete coverage of Germany.
Roughly rounding the numbers the geographic extends of Germany are
     55.5 N
5.5 E    15.5 E
     47 N
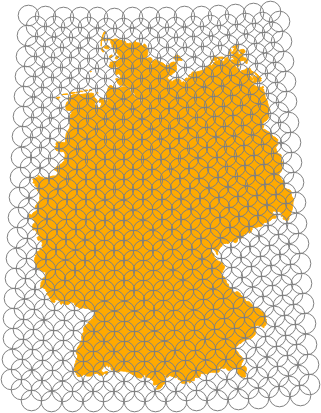
To fully cover an area with fixed size circles you can just put rows of circles into it, shifting each row by the radius of the circles. This will lead to quite some overlap but definitely cover all of it.
The problem here is that we specify coordinates in WGS84 (a geographic coordinate system) while the radius is specified in meters. The ratio between degrees and meters depends on the latitude: In the southern-most corner of Germany (~47° latitude) longitudes are 76 kilometers apart while in the north (~56° latitude) it is just 64 kilometers (Source). The distance between latitudes is always roughly 111 kilometers (Source).
The maximum radius we can use is 50 kilometers. At 47° latitude this is 50/((2*pi*6371*cos(47*pi/180))/360) = 0.65°. So we can step by 0.65° in the west/east direction and shift 0.65°/2 = 0.32° sideways on subsequent (north/south) lines which themselves are 0.22° (50/112/2) apart. You can see the resulting increase of overlap towards the north in the image on the right.
You could load the resulting list of coordinates and remove the unnecessary ones with QGIS. Or alternatively download them all once, see which ones returned zero data and remove those coordinates. Either way, you can significantly reduce the number of requests to the website.
I used a bash script to perform all the resulting requests. If you do it yourself please consider adding a pause between requests and using a custom user-agent with your contact details in case the service administrators want to contact you. If you do this nicely and handle the resulting dataset responsibly, you should not have anything to worry about. But always keep in mind that you are accessing an API that was not likely published to be used like that.
Next: Turning the XML into a data format that you can easily load into QGIS.


cooles Tutorial! Wann geht es weiter?
Danke! Eigentlich letztes Wochenende… ;) Der Datenaufbereitungsteil ist fertig, ich prokrastiniere nur noch wegen der Karte.
Hi,
Is there now a source for all the data in file format or an API with all fuel prices for all gas stations in Germany?
I would really appreciate.
Thanks