I love year-review posts with recommendations so here is some music that mattered to me in 2025. Some I a) listened a lot to in 2025, b) discovered in 2025, c) re-loved in 2025 or d) just want to make you try. Sometimes I picked single songs, do try other songs of the artists too. The list is randomized.
I have a raster where each cell is categorized with a value of either 1, 2 or 3.
In #QGIS, how would I determine the percentage of cells in each category?
This piqued my curiosity so here you go!
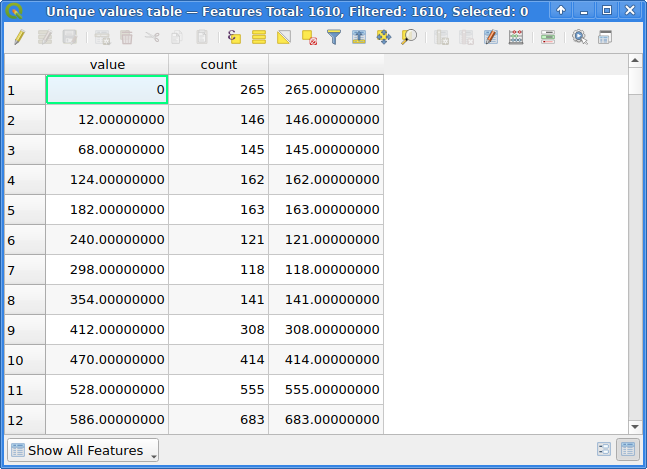
The Raster layer unique values report tool provides both a table containing value & count columns and a number of outputs, among other things TOTAL_PIXEL_COUNT and NODATA_PIXEL_COUNT.
Unique values tables for a UInt16 raster
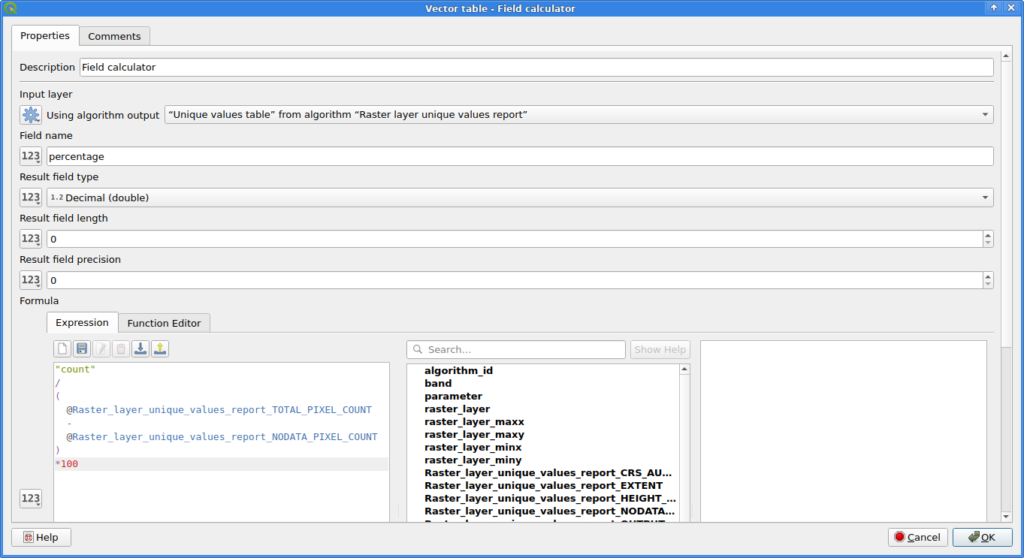
The Field calculator can be used to calculate an additional column for the table. Note that I decided for NODATA pixels to not count towards the total number of pixels here!
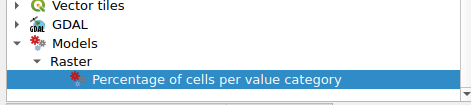
Combine them in a model, add appropriate inputs and you have a fancy new QGIS tool to calculate the percentages of each value in a raster image:
For audiobooks use Opus with a low bitrate of 16 kbps and the Additional encoder argument -ac 1 for mono.
Copy directory structure will create full path directories in the destination directory, e.g. if you convert /home/foo/music/ to /tmp/, it will create the output in /tmp/home/foo/music/.
For future updates: Select the same directories, fix the xml again, make sure that Settings -> General -> Conversion -> Conflict Handling is set to “Skip File”.
Make sure its USB mode is set to MTP mode, not Garmin mode.
Watch dmesg to see when the device is connected and ready:
[Fri Jun 28 15:27:59 2024] usb 1-2.1: new high-speed USB device number 36 using xhci_hcd
[Fri Jun 28 15:27:59 2024] usb 1-2.1: New USB device found, idVendor=091e, idProduct=CENSORED, bcdDevice= 0.01
[Fri Jun 28 15:27:59 2024] usb 1-2.1: New USB device strings: Mfr=0, Product=0, SerialNumber=5
[Fri Jun 28 15:27:59 2024] usb 1-2.1: SerialNumber: CENSORED
Use lsusb to verify:
Bus 001 Device 036: ID 091e:CENSORED Garmin International
android-file-transfer/aft-mtp-mount will not enable to you to write files on to it, instead it will show your device does not have android EditObject extension, you will not be able to write into individual files if you mount with it and creating files will lead to cannot create regular file errors.
I did not manage to put the display directly on top of the Pico as a hat. Also my display’s board has its pins numbered and labelled mirrored when comparing to the official pin out. FFS…!?
Install pico-sdk and thonny from AUR.
$ sudo usermod -a -G uucp $USER
Reboot.
Make sure you aren’t full of static electricity. Hold the BOOTSEL button on your PI and connect it to your PC using a USB cable.
It should appear as storage device.
Start Thonny, select “Micropython (Raspberry Pi Pico)” as interpreter and use its “Install or update MicroPython” option. This does that “copy some RPI_PICO-20231005-v1.21.0.uf2 file to your Pico in mass storage mode” step for you.
The Thonny shell should say something like:
MicroPython v1.21.0 on 2023-10-06; Raspberry Pi Pico with RP2040
Type "help()" for more information.
>>>
Enter the following code in your Thonny shell (via):
from machine import Pin
led = Pin(25, Pin.OUT)
led.on()
The Pico’s green LED should glow now. Use led.off() to turn it off again.
Unplug your Pico. Make sure you aren’t full of static electricity.
Use your favorite MPD client (or the web UI) to play some music (FIRST SET A LOW VOLUME for safety, 100 is insane here, ~20 is room level). It should work already, if not, troubleshoot.
“Audio” -> “ALSA Options” -> “Max volume (%)” seems to do nothing
“Audio” -> “MPD Options” -> “Volume options” -> “Max MPD volume”: Set to 30% so at least in the Web UI of moOde you won’t be able to kill your speakers.
In your other MPD clients, make sure you never set a high volume…
Music on connected storage will be discovered automatically and added to your library.
I just wanted to see if it was possible, it is not a sane thing to do.
PostgreSQL has a notification event system where you NOTIFY on a notification channel and clients can LISTEN for events.
QGIS already supports this for a convenient, remotely triggered refresh function of PostGIS layers by listening on the qgis channel if a PostgreSQL connection exists:
Load a PostGIS layer
Set its symbology to something dynamically randomized so you see changes if the map is refreshed
In the layer’s rendering options set it to refresh on notification
In a PostgreSQL client trigger a notification event, e.g. NOTIFY qgis, 'hi'; or SELECT pg_notify('qgis', 'refresh plz!');
The layer is refreshed in QGIS
You can set the layer(s) to refresh on any event on the qgis channel or only for specific messages. For example you could set each PostGIS layer to refresh on a different message, e.g. their table name and use that in a PostgreSQL trigger.
QGIS comes with PyQt and PyQt (of course) has its own API to let you talk to database servers. And luckily its QSqlDriver class even has a notification signal that let’s you react to notification events in the most convenient way.
So I wrote something:
from qgis.PyQt.QtSql import QSqlDatabase, QSqlQuery, QSqlDriver


def exec_notification(name, source, payload):
    """ZOMG don't ever do this!"""
    try:
        exec(payload.replace('\\n', '\n'))
    except SyntaxError as e:
        iface.messageBar().pushMessage("PG NOTIFY", str(e))

db = QSqlDatabase.addDatabase("QPSQL")
db.setConnectOptions("service=foo")  # using ~/.pg_service.conf
if not db.open():
    raise Exception(db.lastError().databaseText())
db.driver().subscribeToNotification("qgis_qtsql_channel")

db.driver().notification[
    str, QSqlDriver.NotificationSource, "QVariant"
].connect(exec_notification)
Run it in QGIS’ script editor and now you can remotely execute any Python code by sending it from PostgreSQL. For example:
Of course this is a horrible idea and you should never run code that a third-party sends to you. Instead you should write specific methods on the Python side and sent well defined messages to control exactly which methods get executed. But, hey it works!
Ideas
Trigger a notification if a PostgreSQL-stored QGIS project gets updated and in QGIS notify the user if they have said project open.
Make a tiny plugin that lets the user specify a mapping of message -> Python code scripts
TBC
Addendum
At first I had used a simple db.driver().notification.connect(on_notification), expecting the slot to simply receive all the arguments that the notification signal would send. But this led to Qt using a different notification signal (just sending the channel name) or something because the name is overloaded. Qt super explainer eyllanesc once again saved the day by showing that one can (and in this case needs to) specify the correct signature so Qt picks the correct signal to connect to. This was a major learning for me.
For debugging I used another slot function connected to the signal which uses both the QGIS message log and the message bar to inform the user about incoming notification events, take it if you want:
A bad surprise to me was that my QGIS installation on Ubuntu 22.04 (using https://qgis.org/ubuntu) did not have a dependency graph that included PostgreSQL support in QtSql. Ouch! I would have thought this would be usable in any standard QGIS installation out of the box. I had to install libqt5sql5-psql. On Windows this seems to be no issue, both a MSI installer and an advanced OSGeo4W install had the necessary modules. Phew!
The [PythonPlugins] section uses the plugins’ directory names and shows if a plugin is activated or not (true/false).
Plugins can store their options anywhere. No really. Anywhere! You will find some in their own sections, e. g.:
Qgis2threejs (directory “Qgis2threejs“) uses a [Qgis2threejs] section, named the same as its directory
First Aid (firstaid) uses a [FirstAid] section, using different case than its directory, and another section [firstaid] for other options
Plugin Builder 3 (pluginbuilder3) uses a [PluginBuilder] section, named differently than its directory
QGIS GML Application Schema Toolbox (gml_application_schema_toolbox) stores options in [QGIS%20GML%20Application%20Schema%20Toolbox] (needlessly) using URL encoding
Räumlicher Filter (spatial_filter) uses two sections: [SpatialFilter] and [SpatialFilterSymbol] (sorry, we didn’t know better…)
There is a [Plugins] and a [plugins] section. I found some plugins storing some options in the [plugins] section, e.g. First Aid storing some firstaid\debugger-geometry=... there. [Plugins] seems to be used by core plugins. [plugins] stores e.g. if QGIS should automatically check for new ones (although that is also might be tracked in the [plugin-manager] section, no idea which option comes from an older QGIS version maybe).
Some things can be stored elsewhere, I am not sure who does it, maybe some objects do this automatically? E.g. in the [QgsCollapsibleGroupBox] section you might find the states of all(?) QgsCollapsibleGroupBox objects such as gml_application_schema_toolbox\gmlas_bbox_group\collapsed=false concerning a plugin’s widget. Or in [Windows] you might find FirstAidDebugDialog\geometry=....
Plugins might alter any other options of course. There is no way of knowing what plugin touched what (great power and mostly good :) ).
Uninstalling a plugin does not remove the sections from the INI. The plugin itself does not have a chance to clean that up and QGIS has no way of knowing what to remove. (Of course it might be wanted to keep settings around, but it would be nice to be able to really prune something.)
tl;dr: There is no standard, no rules nor best practices for QGIS plugins to store their options.
PS: This post might get updated as I learn. Corrections and improvements are highly appreciated.
PPS: Excuse the big bold highlighting. That’s for me.
Hetzner is a nice, cheap host for server. Unfortunately they do not let you download backups and snapshots of cloud servers locally. So you are kind of locked in with them.
Here is how I create full disk backups for e.g. standard CX11 servers with default images.
Make sure you understand everything before you attempt this. Pay special attention to your own partitions and make sure you archive what you really need. Consider imaging the whole device instead of just a partition.
Create a backup
Create a new snapshot of your server
Create a new server from it
Boot said server in rescue mode
Use good old dd and gzip to image the main disk to a local archive
The bs=1M is fairly random by me, worked well, didn’t care to optimize
gzip (with the default compression level) kind of maxed out the server CPU but still enabled me to almost max out my download bandwidth. Of course the ratio between remote CPU compression speed vs download bandwidth depends on your specific situation. You might want to use xz or zstd instead.
Consider nulling everything but the files first, i.e. mount your partition and dd if=/dev/zero of=zeros bs=4M status=progress on it.
Don’t be stupid, do it twice and compare the checksums
If you do not need your server to be live during backup, you can skip the snapshotting and second server of course, just boot your server in rescue mode instead.
Build a new server from a backup
Create a new server using the same or a similar configuration as the backed up one


