I collected all the daily images of the satellite-based Soumi VIIRS sensor and calculated the per-pixel average over the whole year of 2018.
You can explore it in full resolution in an interactive webmap.

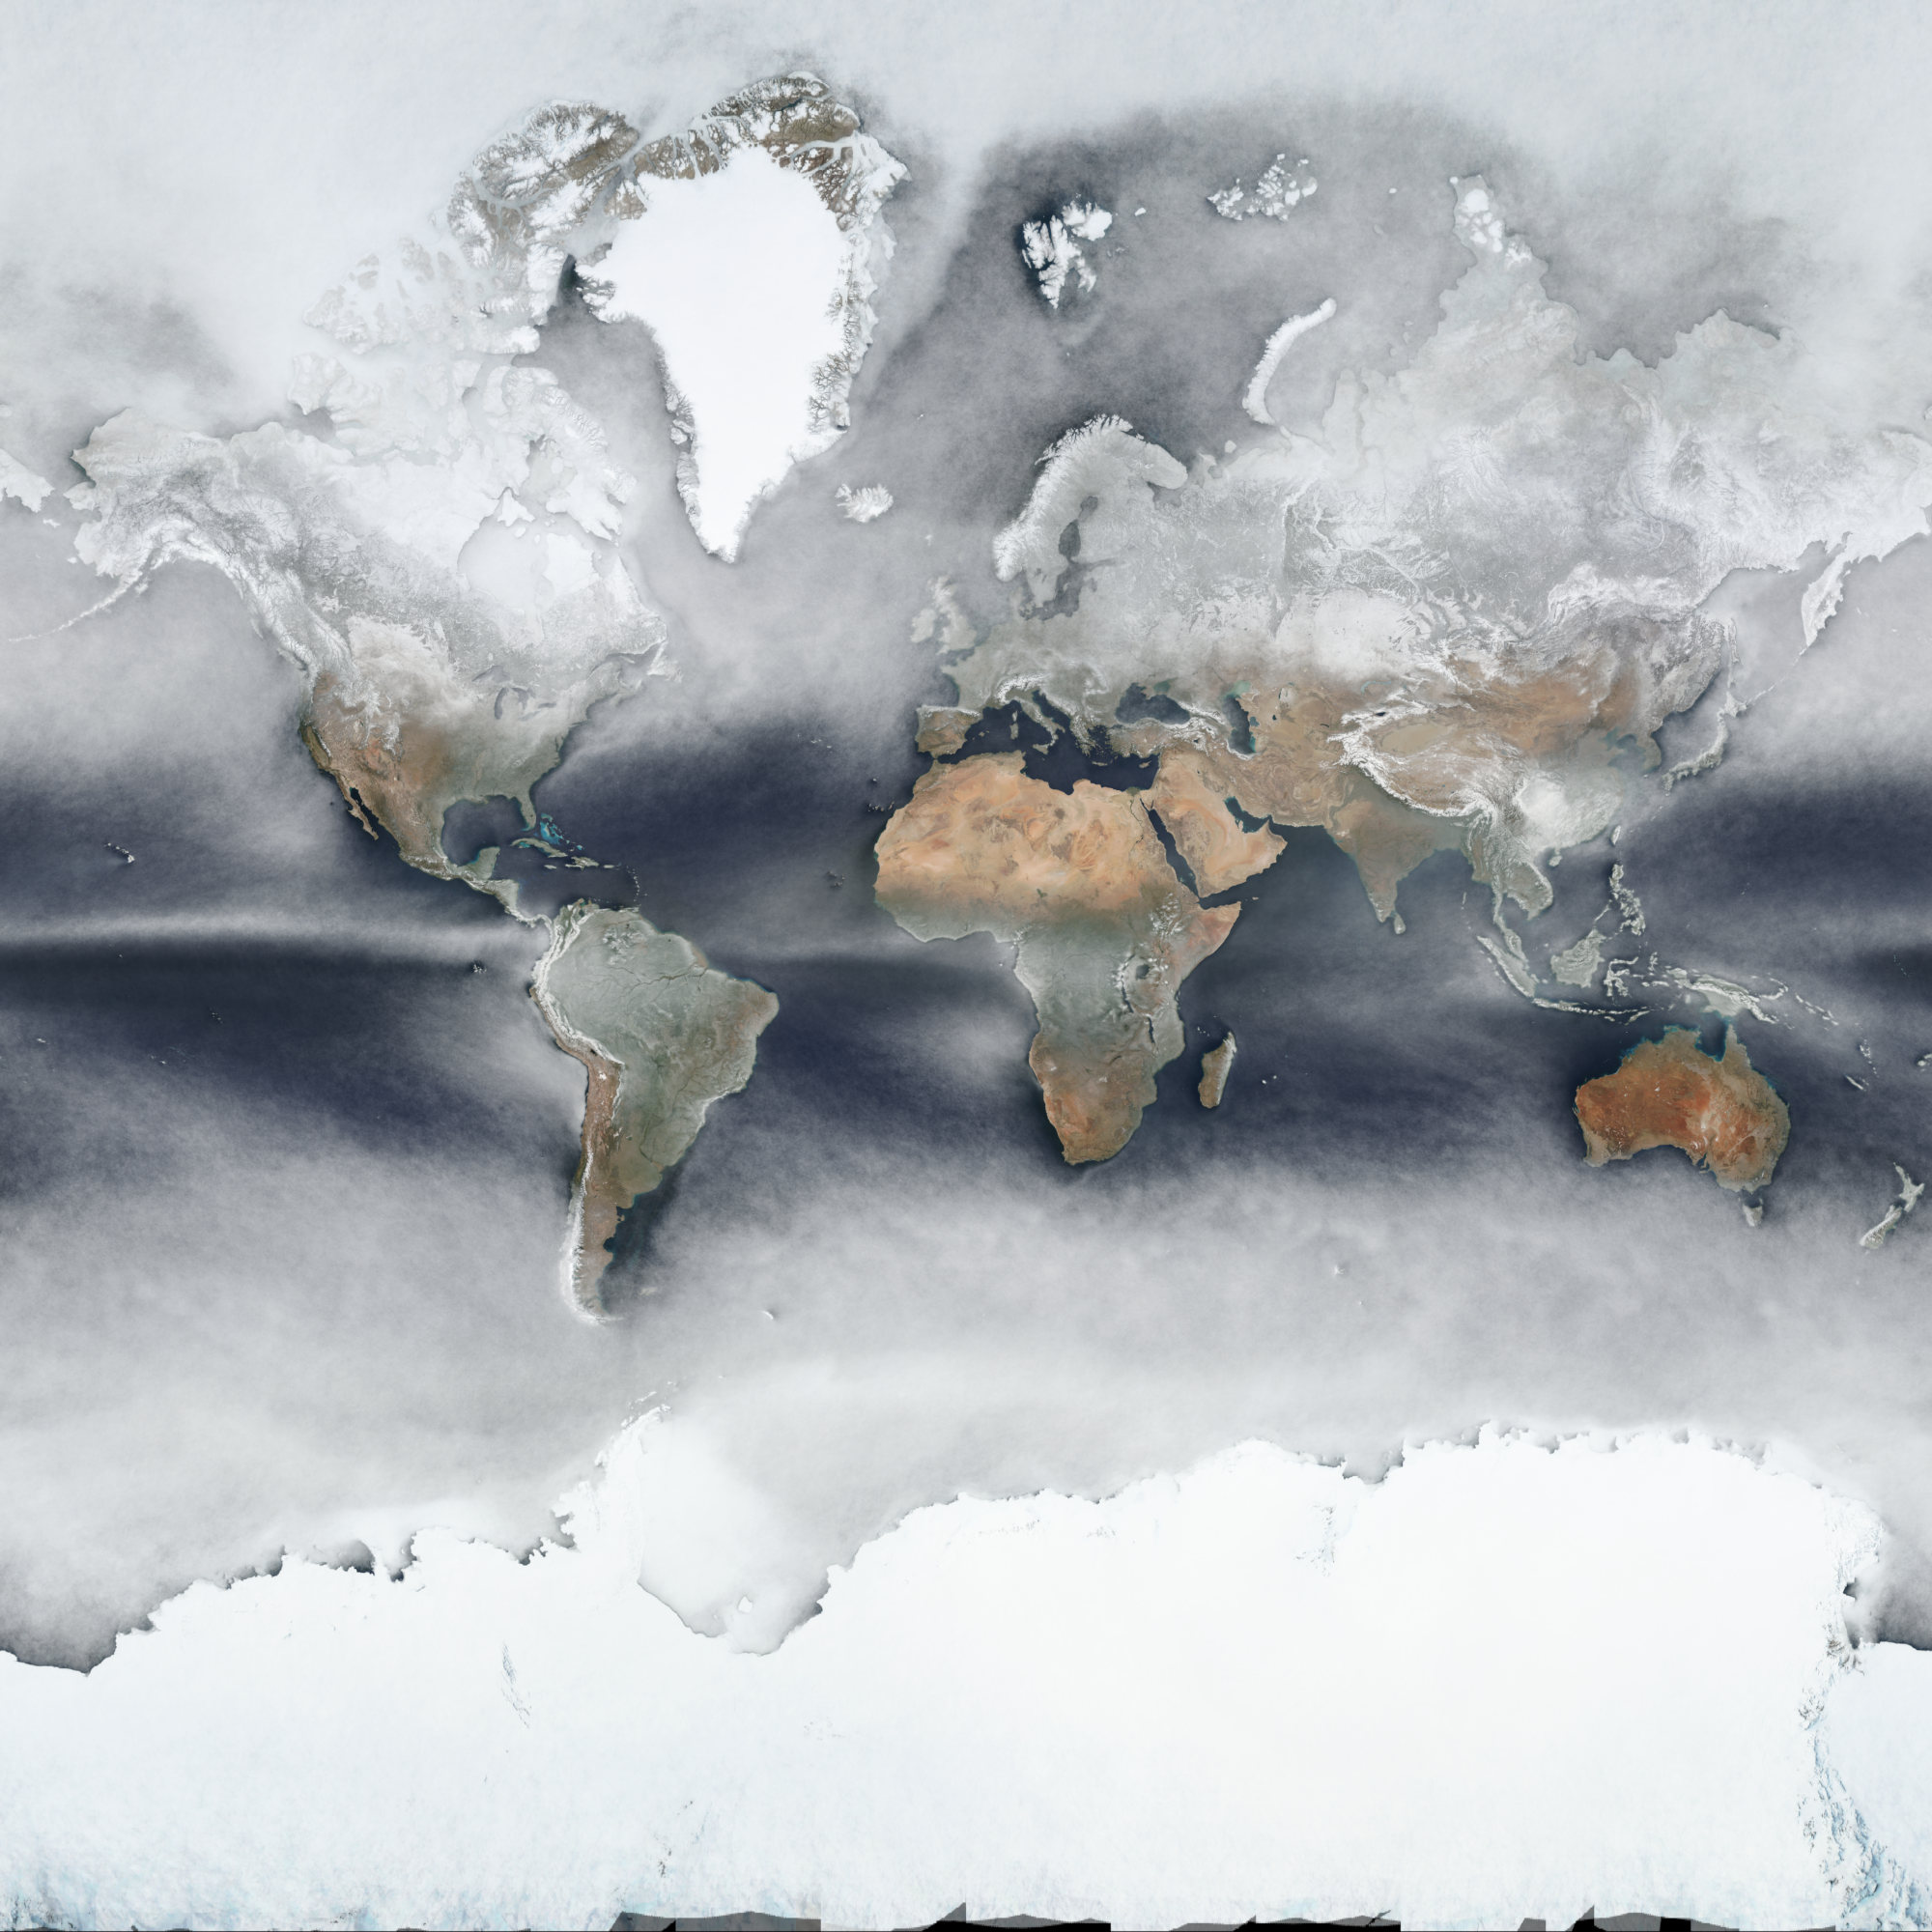
You can see fascinating patterns, e.g. “downstream” of islands in the ocean or following big rivers like the Amazon. Be wary though as snow and clouds look the same here.


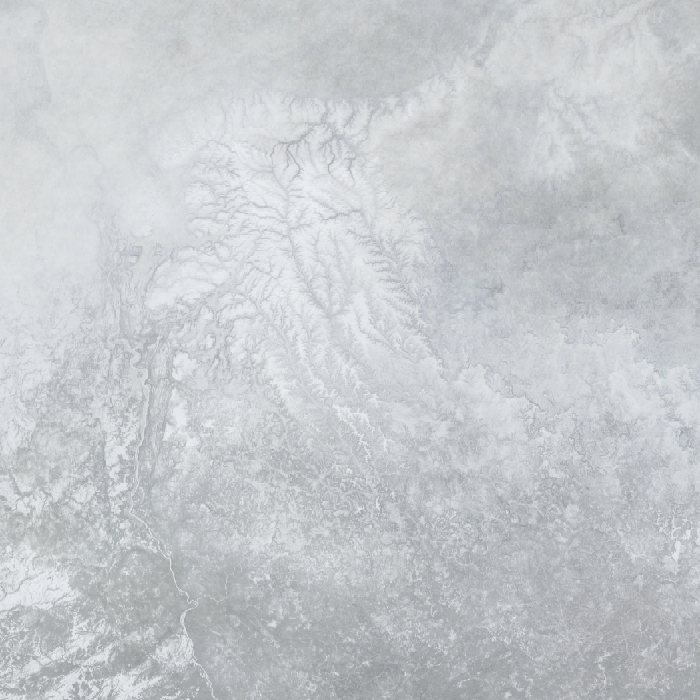


It’s also fun to look at the maximum to see cloudless regions (this image is highly exaggerated and does not make too much sense anyways):

Many thanks to Joshua Stevens for motivation and infos on data availability! The initial idea was of course inspired by Charlie ‘vruba’ Lyod‘s Cloudless atlas works. I explored imagery on https://worldview.earthdata.nasa.gov/, grabbed Soumi VIIRS images via https://wiki.earthdata.nasa.gov/display/GIBS/GIBS+API+for+Developers and processed it in GDAL. Poke me repeatedly to blog about the process please. (2022: Or don’t, I didn’t document it back then and can’t remember the final specifics. I think I did use imagemagick’s -evaluate-sequence median but might have done something in vips2 instead. The 2020 approach via GDAL is much easier.)
Full resolution, georeferenced imagery as Cloud-Optimized GeoTIFF:
*I said average but of course it is the median. The average or mean does not make much sense to use nor does it look any good. ;-)
Hey I would love full res image, to be printed on my wall! I have many maps and i love maps. Found you from /r/mapporn ? would you mind..? thanks!
same here!
Pingback: Una imagen promediada de la superficie terrestre durante un año
i would like the full resolution of the map
Pingback: El mapa promedio de la Tierra creado con imágenes satelitales
Pingback: Blog Personal | Average Earth from Space 2018
I would love the full res image of the map. Thanks!
It would be great to see also the median day and check differences with the average one.
Great job!
Pingback: Este fascinante mapa de la Tierra promedia las fotos de satélite de todo un año en una sola imagen – El Independiente Periódico Digital
Pingback: O ceo galego promedio desde o espazo – Ceos Galegos
looks like there’s mould in the Amazon
Pingback: Allgemeines Live-Blog vom 12.-18. Februar 2019 | Skyweek Zwei Punkt Null
Pingback: Johannes Kröger to GeoHipster: “$existing_free_software can do that already.” | GeoHipster
Pingback: Sentinel-2 cloudless 2019 – EOX
Dear Han,
I’m a science researcher based in London. I’d like to use your “average Earth” image as part of a Figure in an academic publication. I will receive no payment myself for this publication. I am happy to buy the full-res image from you on Etsy, but I would need confirmation from you that you consent to your image being reproduced in my academic paper. Please could you email me to discuss?
Many thanks!
Lewis
Pingback: Satellite composite of Earth 2020 | Hannes ihm sein Blog
Pingback: 2018: Die durchschnittliche Welt | #geoObserver
Pingback: Johannes Kröger to GeoHipster: "$existing_free_software can do that already." - GeoHipster