I built this last year for some research and then swiftly forgot about releasing it to the public. Here it is now:
https://gitlab.com/Hannes42/OpenLayersViewTracker
Try it online: https://hannes42.gitlab.io/OpenLayersViewTracker/
Some awful but working JavaScript code to track a website user’s interaction with a Open Layers map. You can use this to do awesome user studies and experiments.
- Runs client-side
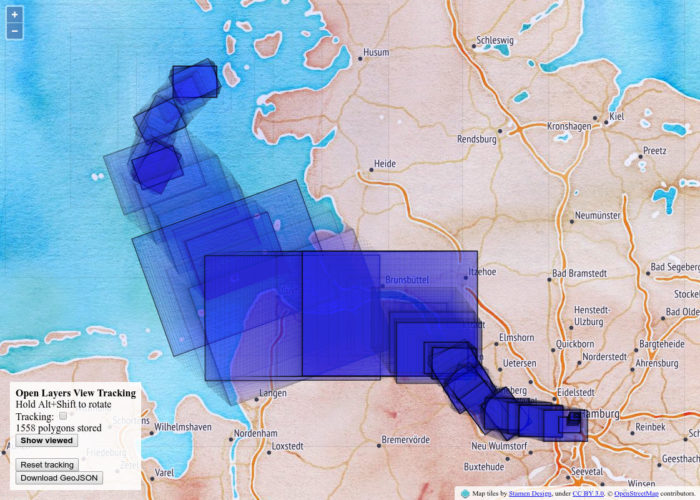
- You will get a polygon of each “view”!
- You can look at them in the browser!
- There are also timestamps! Hyperaccurate in milliseconds since unix epoch!
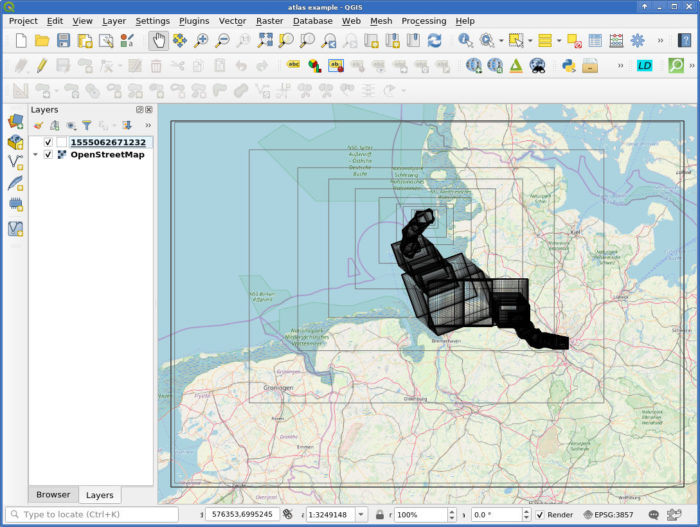
- And a GeoJSON export!
- This works with rotated views!
- Written for Open Layers 4 using some version of JSTS, see the libs/ directory. No idea if it works with the latest versions or if Open Layers changed their API again.
Please do some funky research with it and tell me about your experiences! Apart from that, you are on your own.
There is a QGIS project with example data included. Check out the Atlas setup in the Print Layout!
Screenshot from a browser session

Resulting GeoJSON in QGIS

So if Time Manager supports the timestamp format you could interactively scroll around. I did not try, that plugin is so finicky.