I showed this at the annual meeting of the swiss user group in June 2019 and promptly forgot to post it for everyone to see. Let’s blame the scenery?
Have a raster.
Processing -> Create Grid, covering it with points in a spacing of your choice. Use the same CRS as your raster (unless you want to figure out expression-based geometry transformations on your own, like in my elevation lines code)
Change the Symbol layer type to Geometry Generator and enter
with_variable(
  'radius',
  3333,
  buffer($geometry, @radius, 16)
)
where radius should be a value about one third of your spacing.
You should see circles!
For the fill color use this expression and adjust the name of your raster layer:
with_variable(
    'raster_layer',
    'DHM200.xyz',
    ramp_color('Blues',  -- change to an other named ramp here if you like
        scale_linear(
            raster_value(
                @raster_layer, 1,
                centroid($geometry)  -- back to our point
            ),
            raster_statistic(
                @raster_layer, 1,
                'min'
            ),
            raster_statistic(
                @raster_layer, 1,
                'max'
            ),
            0, 1  -- new scale as color ramps go 0 to 1
        )
    )
)
This will get the raster value below our grid point and fit it onto a color ramp between the min and max of all the raster values.
For the stroke use the same expression but wrap darker(..., 150) around it so you get a darker color.
Using Draw Effects add a small Drop Shadow to your circles. I used an offset of 0.5 mm and a blur radius of 1 mm.
Now add another Geometry Generator symbol layer below your existing one and use the following expression:
bounds(buffer($geometry, 5000))
with_variable(
  'radius',
  5000,
  bounds(
    buffer($geometry, @radius)
  )
)
with the radius being half your grid spacing.
Use the same expressions for the colors as above but set the darker value to 200.
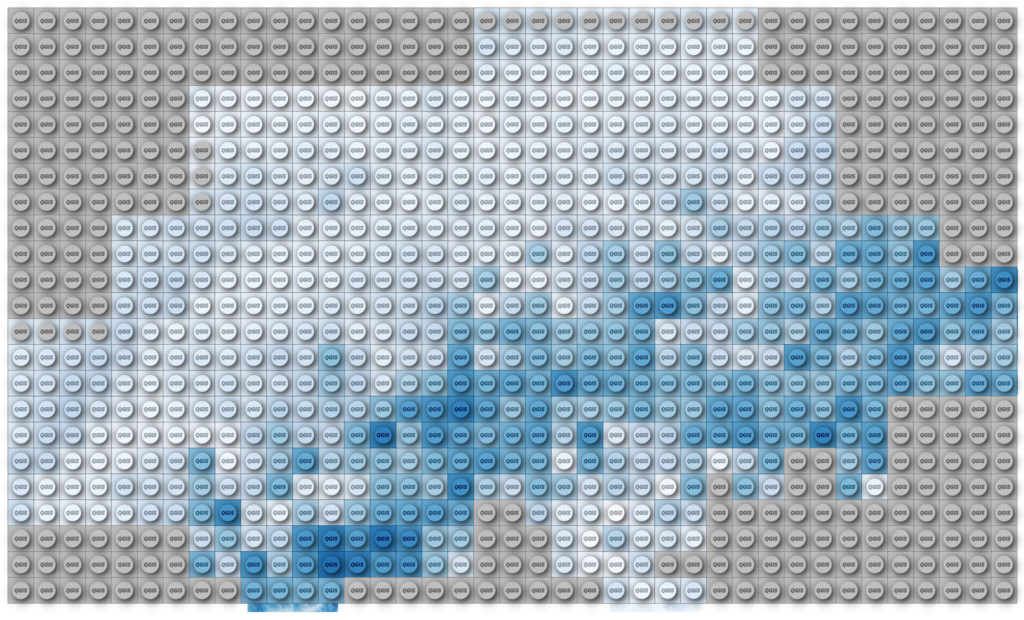
For some more fanciness maybe add a “QGIS” text on top of the nupsies?
Exercise: Make it so that the result perfectly covers the raster, instead of being one grid cell off like mine.