I wanted to monitor my ISP’s service over time and could not find any available simple tool for that. The usual system monitoring tools are usually displaying averages, not min/max values. So I used WD40 (speedtest-cli) and duct tape (cron) to make my own.
You need to have a cron daemon set up and speedtest-cli installed.
Then prepare an empty csv file with a header like this (don’t forget a trailing newline!) and store it in a path of your choice:
Server ID,Sponsor,Server Name,Timestamp,Distance,Ping,Download,Upload,Share,IP Address
Set up a cronjob at an interval of your choice (don’t be a dick) to run a speed test and log the results to the csv file:
@hourly speedtest --csv >> /home/user/path/to/speedtest.csvIf you have a fast connection you might spot slow test servers that would badly bias your results, so exclude them using the --exclude option if necessary.
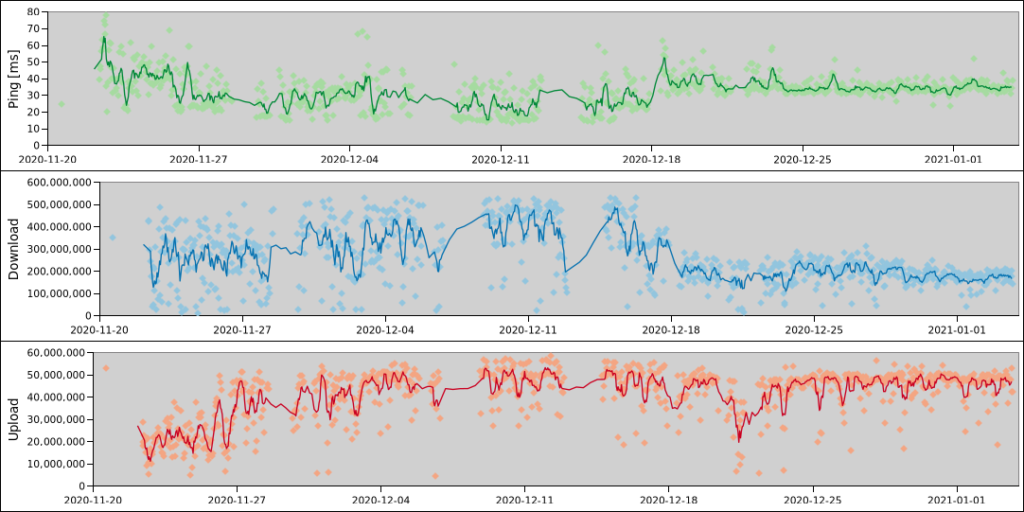
That’s all, you get a nice log of internet ping, upload and download speeds, ready to be visualized in your software of choice (like the best spreadsheet software in existence). I will have to complain to my ISP for that drop since mid December for sure:

And now that I have written this, I realise that for plotting I could also just use a min/max function for a moving time window in Grafana I guess? The speedtests would still be triggered and provide nice bursts of usage. Anyone got pointers on how to do that?