tl;dr: GMT is documented for people who use it since the 80s.
update 2: You can use gmtinfo to calculate the extents, using -I- will make it output the -R parameter! xyz2grd $(gmtinfo -I- *.xyz) ...
update: xyz2grd supports GeoTIFF via its GDAL driver (now?)! For example -Gfile.tif=gd:GTiff. See eg http://gmt.soest.hawaii.edu/doc/5.2.1/grdconvert.html. So the way below is overly complicated. I do not know how to apply the advanced settings of GDAL though like compression and prediction etc.
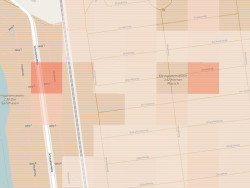
The Statistische Ämter des Bundes und der Länder offer a 100 meter grid of Germany’s population density: csv_Bevoelkerung_100m_Gitter.zip (110MB). Datensatzbeschreibung_Bevoelkerung_100m_Gitter.xlsx provides additional information.
Let’s turn that dataset into a GeoTIFF so we can use it in our GIS. We will use free and open-source tools from GMT and GDAL. GDAL loves to interpolate values but our data is discrete/regular. We do not want any kind of interpolation. So xyz2grd from GMT is the best choice for turning the xyz data into a “continuous” GIS format (tell me if not).
Getting to know the data
Inside the zip is a 1.3GB file Zensus_Bevoelkerung_100m-Gitter.csv with about 36 million lines.
Gitter_ID_100m;x_mp_100m;y_mp_100m;Einwohner
100mN26840E43341;4334150;2684050;-1
100mN26840E43342;4334250;2684050;-1
…
100mN27407E44044;4404450;2740750;3
100mN27407E44045;4404550;2740750;31
100mN27407E44046;4404650;2740750;13
100mN27407E44047;4404750;2740750;14
100mN27407E44048;4404850;2740750;10
Datensatzbeschreibung_Bevoelkerung_100m_Gitter.xlsx says the coordinates are in ETRS89-LAEA Europe – EPSG:3035.
First we need to find out the geographic extends of the data, you could use your favourite cli tools for that, I wrote a quick .vrt file and used ogrinfo on that:
$ cat Zensus_Bevoelkerung_100m-Gitter.csv.vrt
<OGRVRTDataSource>
 <OGRVRTLayer name="Zensus_Bevoelkerung_100m-Gitter">
  <LayerSRS>EPSG:3035</LayerSRS>
  <SrcDataSource>Zensus_Bevoelkerung_100m-Gitter.csv</SrcDataSource>
  <GeometryType>wkbPoint</GeometryType>
  <GeometryField encoding="PointFromColumns" x="x_mp_100m" y="y_mp_100m" />
 </OGRVRTLayer>
</OGRVRTDataSource>
$ ogrinfo -al Zensus_Bevoelkerung_100m-Gitter.csv.vrt
INFO: Open of `Zensus_Bevoelkerung_100m-Gitter.csv.vrt’ using driver `VRT’ successful.
Layer name: Zensus_Bevoelkerung_100m-Gitter
Geometry: Point
Feature Count: 35785840
Extent: (4031350.000000, 2684050.000000) – (4672550.000000, 3551450.000000)
…
Creating a netcdf/grd file from the xyz data with xyz2grd
xyz2grd wants xyz, nothing else. The Gitter_ID_100m column is redundant in any case, you can calculate it yourself from the x and y fields if needed. So first let’s convert it to a “x y z” format with awk. The separator is ;
awk 'FS=";" {print $2" "$3" "$4}' Zensus_Bevoelkerung_100m-Gitter.csv > Zensus_Bevoelkerung_100m-Gitter.xyz
Now we can write our xyz2grd commandline.
We have our extends:
-R4031350/4672550/2684050/3551450
We know the spacing is 100 units (meters):
-I100
There is one header line:
-h1
And of course we know that we want a “classic” netcdf4 chunk size, whatever that means. We knew that right away, not after googling helplessly for an hour and eventually finding the hint on some mailing list. Not knowing this might have lead to QGIS only seeing NaN values for z, R’s ncdf/raster saying “Error in substr(w, 1, 3) : invalid multibyte string at ‘<89>HDF” and GDAL “0ERROR 1: nBlockYSize = 130, only 1 supported when reading bottom-up dataset”.
--IO_NC4_CHUNK_SIZE=c
The resulting commandline:
xyz2grd -Vl -R4031350/4672550/2684050/3551450 -I100 -h1 --IO_NC4_CHUNK_SIZE=c -GZensus_Bevoelkerung_100m-Gitter.cdf Zensus_Bevoelkerung_100m-Gitter.xyz
You can inspect the file with grdinfo and gdalinfo now if you want.
Creating a GeoTIFF from the netcdf/grd file
Let’s turn it into a GeoTIFF with gdal_translate. We will need a bunch of commandline parameters.
The spatial reference system is EPSG:3035, so:
-a_srs EPSG:3035
Values of -1 mean “no data”:
-a_nodata -1
TIFF is uncompressed by default, we want good lossless compression:
-co COMPRESS=DEFLATE
The resulting commandline:
gdal_translate -co COMPRESS=DEFLATE -a_srs EPSG:3035 -a_nodata -1 Zensus_Bevoelkerung_100m-Gitter.cdf Zensus_Bevoelkerung_100m-Gitter.tif
The resulting file is about 8 Megabytes and should work in any reasonable GIS. Have fun!
Downloads
http://hannes.enjoys.it/opendata/Zensus_Bevoelkerung_100m-Gitter.tif
TODO: What license is this now?
