Not sure why I never posted this last year but I did the #30DayMapChallenge in a single day, streamed live via a self-hosted Owncast instance. It was … insane and fun. This year I will do it again, on the 26th of November.
Here are most of the maps I made last year:
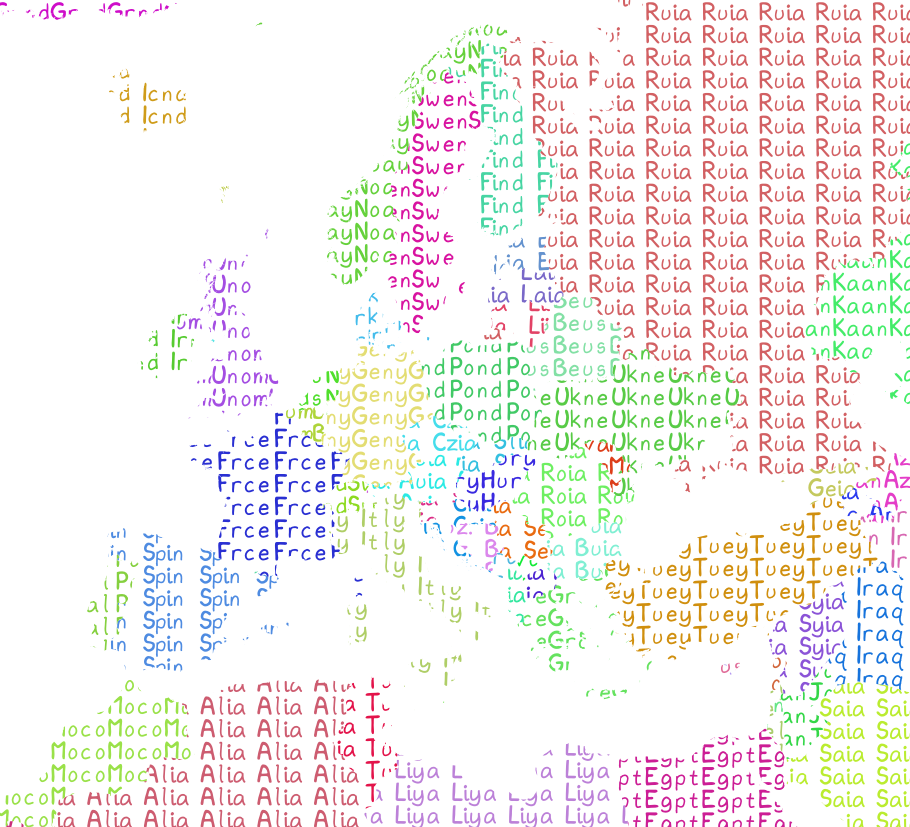
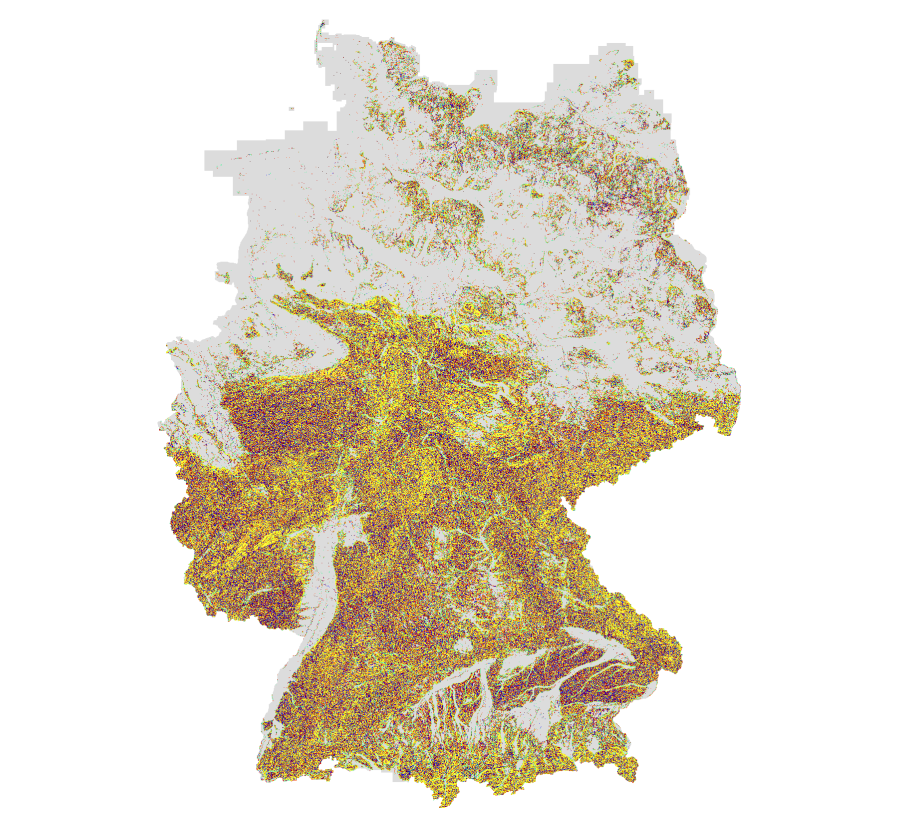
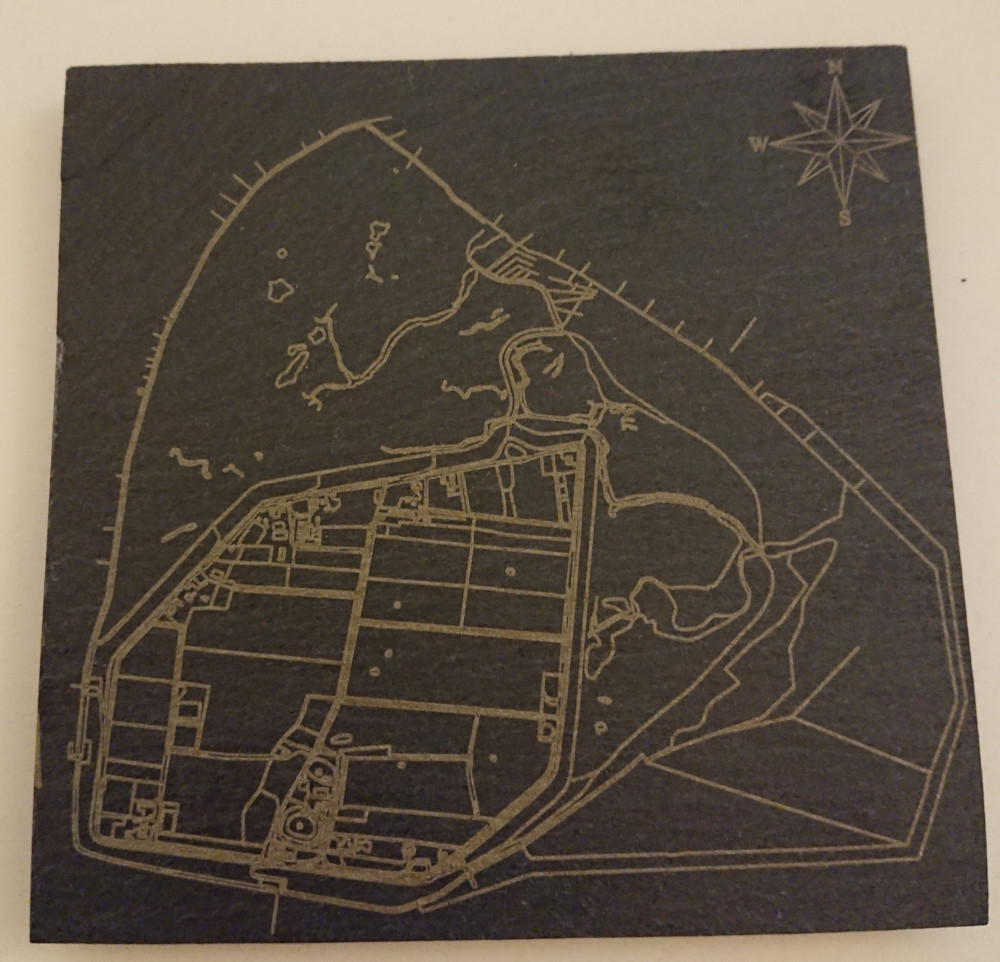

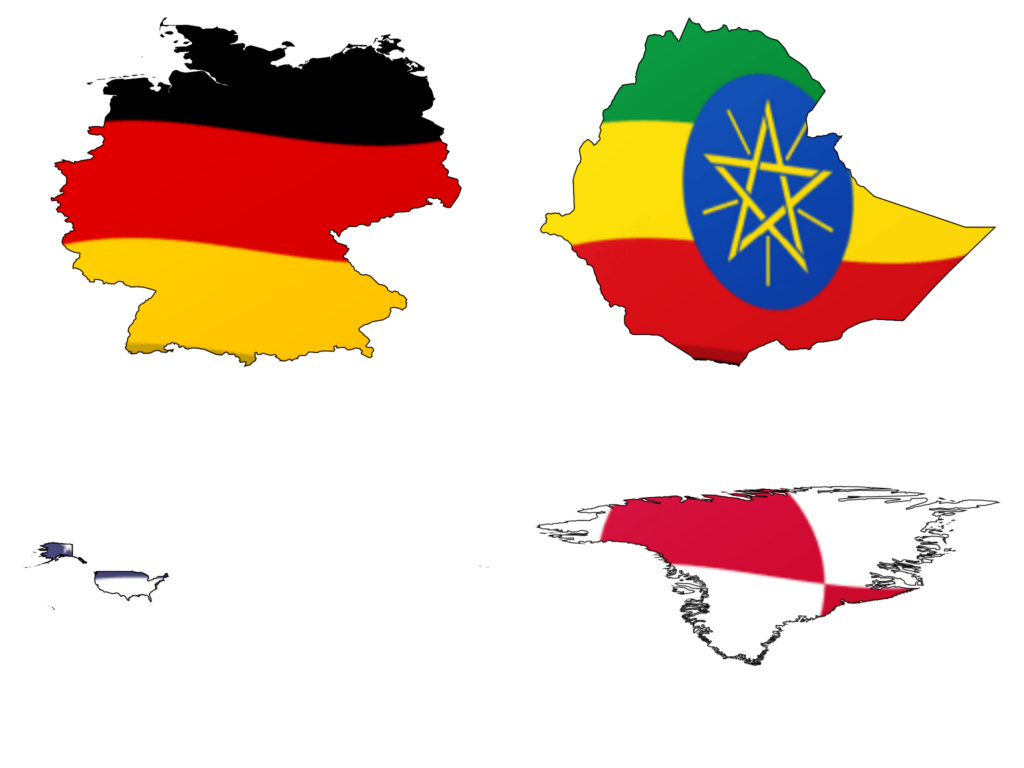
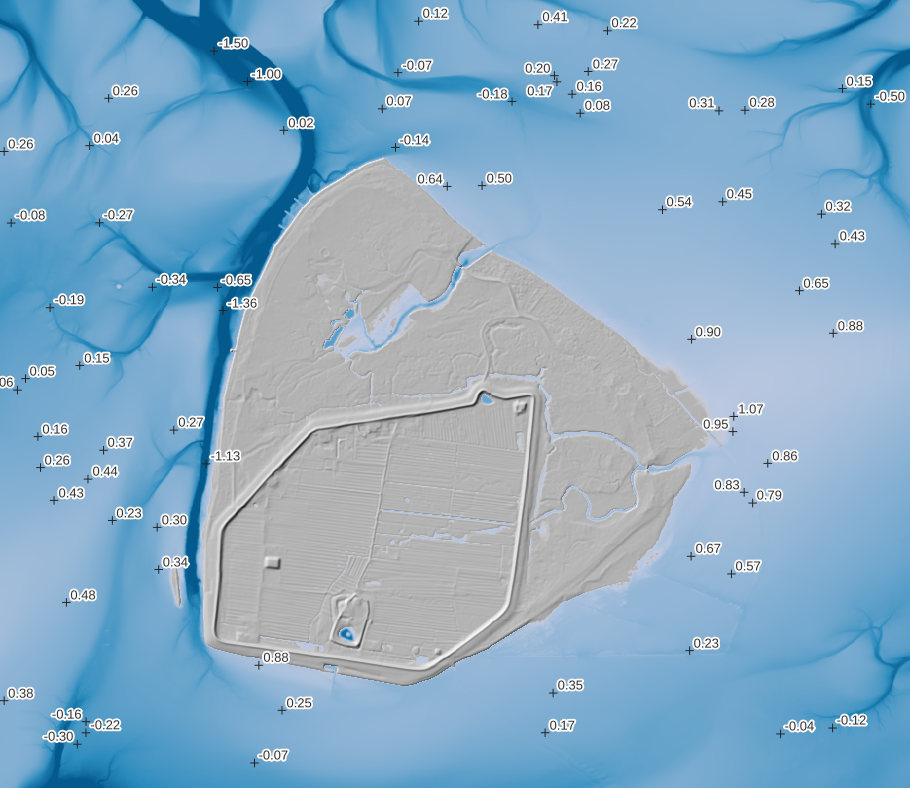
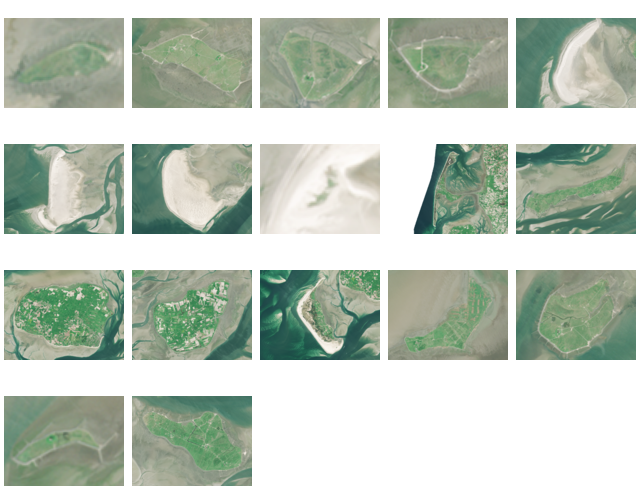
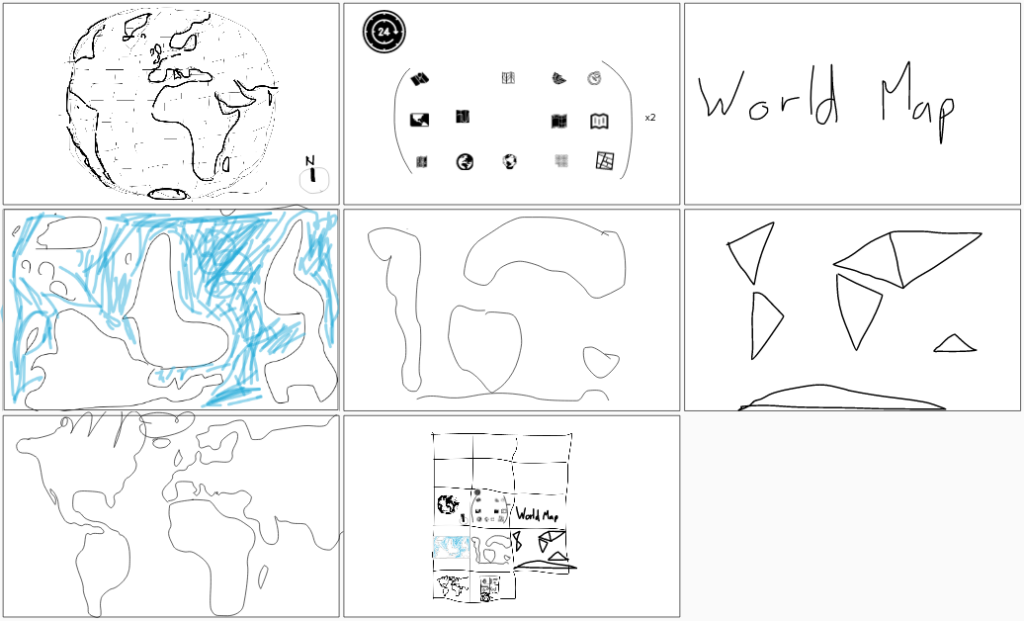
Some notes I kept, please bug me about recovering the others from my Twitter archive (I deleted old tweets a bit too early):
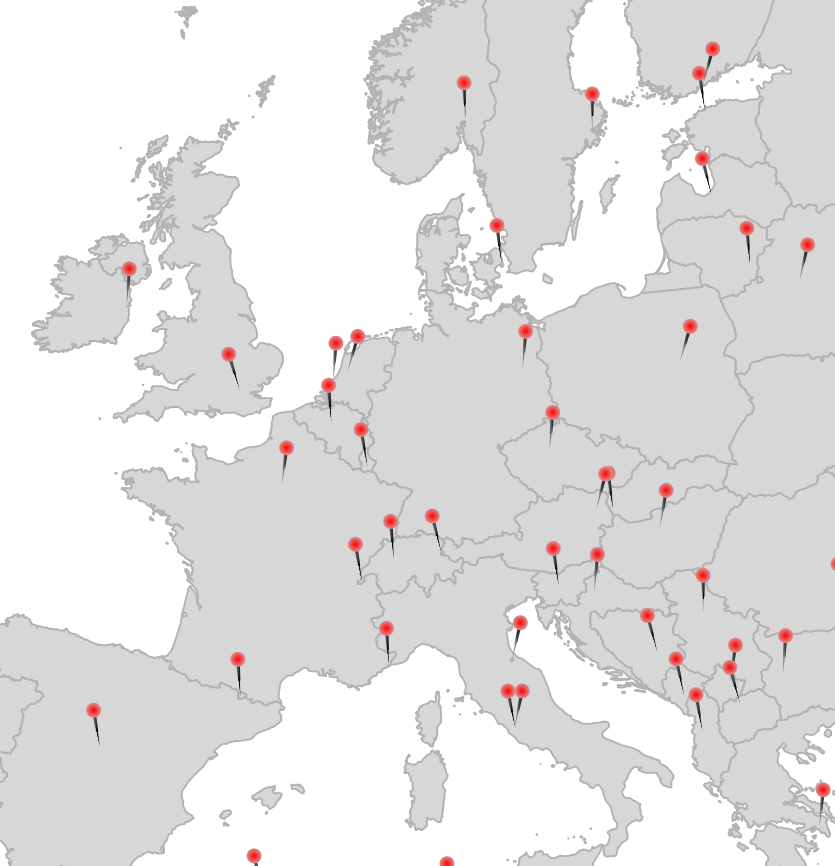
- 1 Points: Pins via Geometry Generator in QGIS
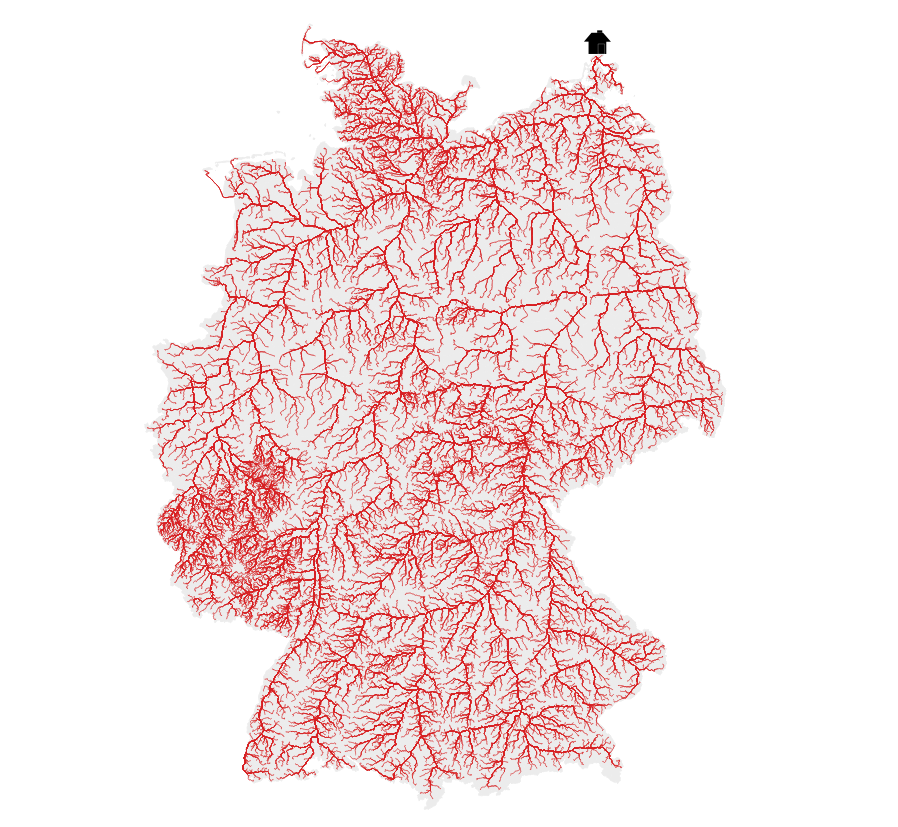
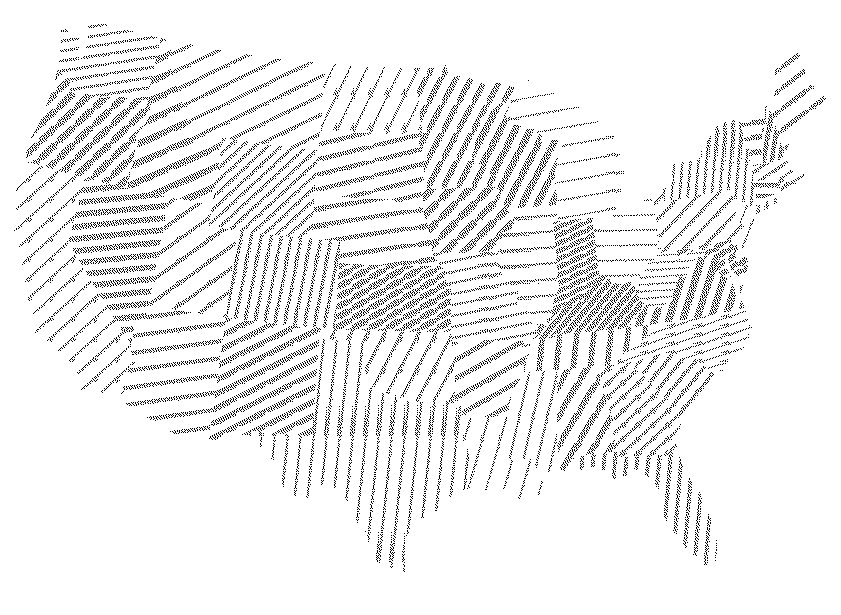
- 2 Lines: River elevation profiles of Elbe, Rhein, Ems, Weser, Donau and Main. DEM: © GeoBasis-DE / BKG (2021)
- 13 NaEr I mean Natural Earth (Blame @tjukanov)
- 18 Water (DGM-W 2010 Unter- und Außenelbe, Wasserstraßen- und Schifffahrtsverwaltung des Bundes, http://kuestendaten.de, 2010)
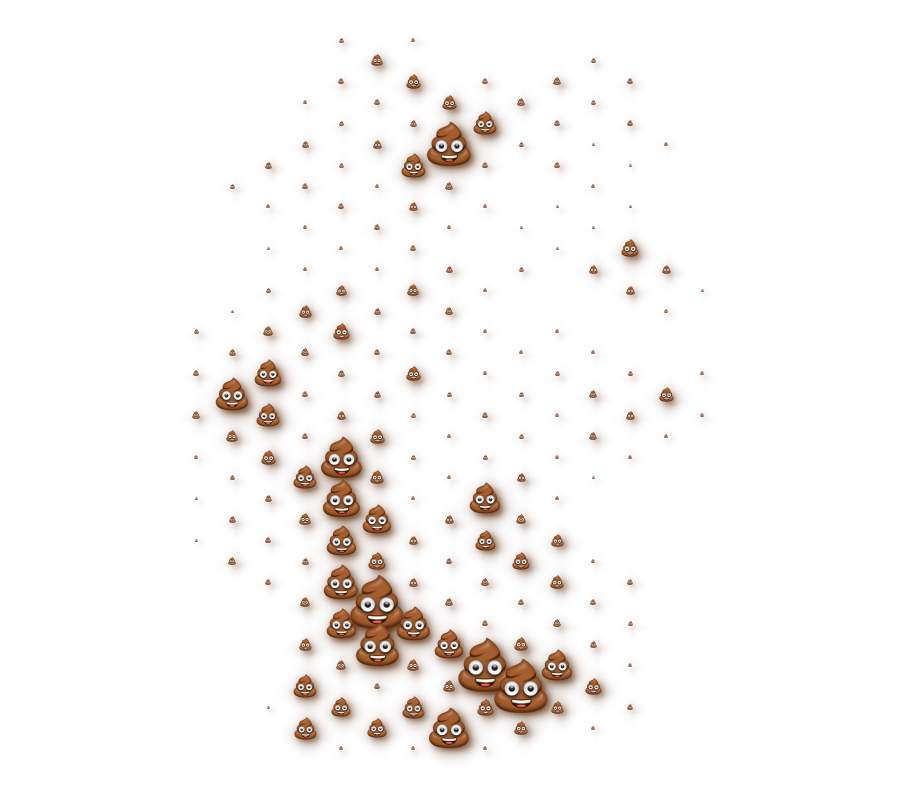
- 20 Movement: Emojitions on a curvy trajectory. State changes depending on the curvyness ahead. Background: (C) OpenStreetMap Contributors <3
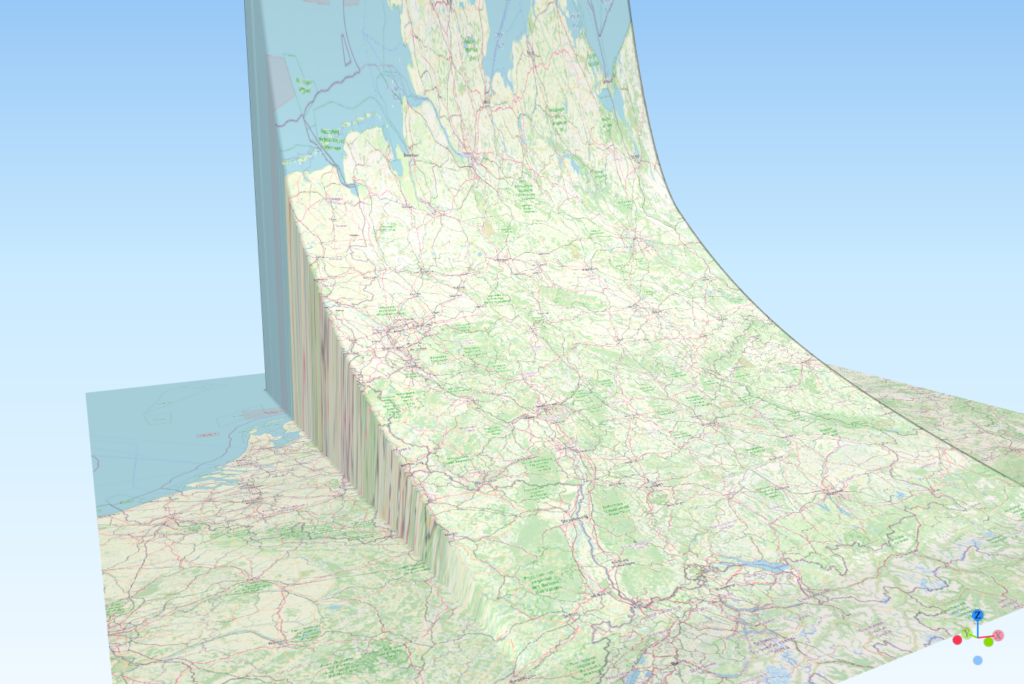
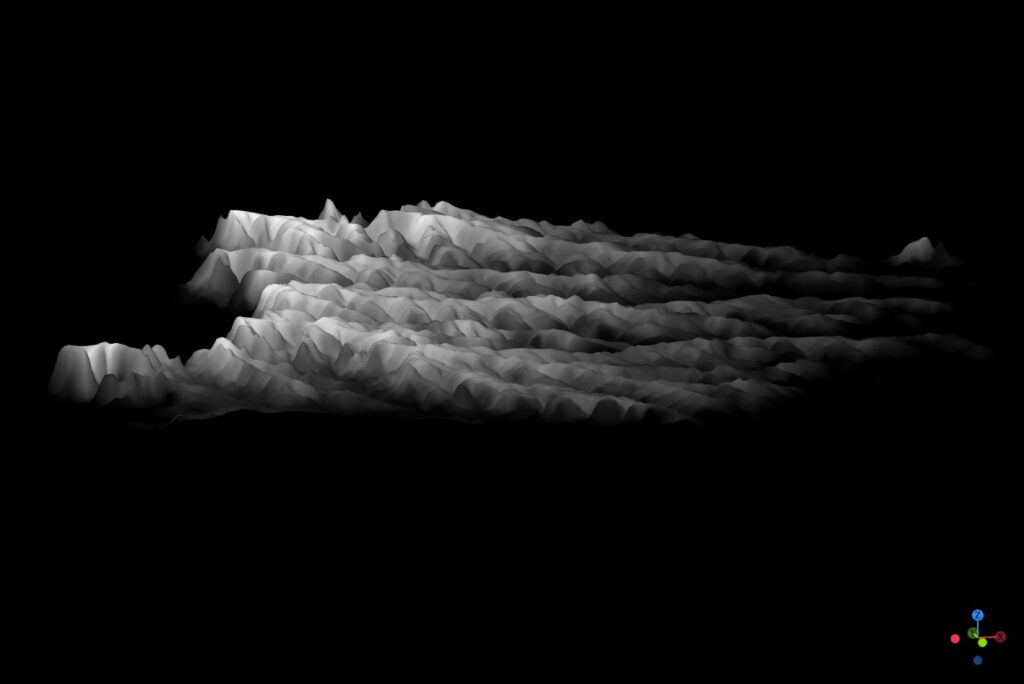
- 21 Elevation with qgis2threejs (It’s art, I swear!
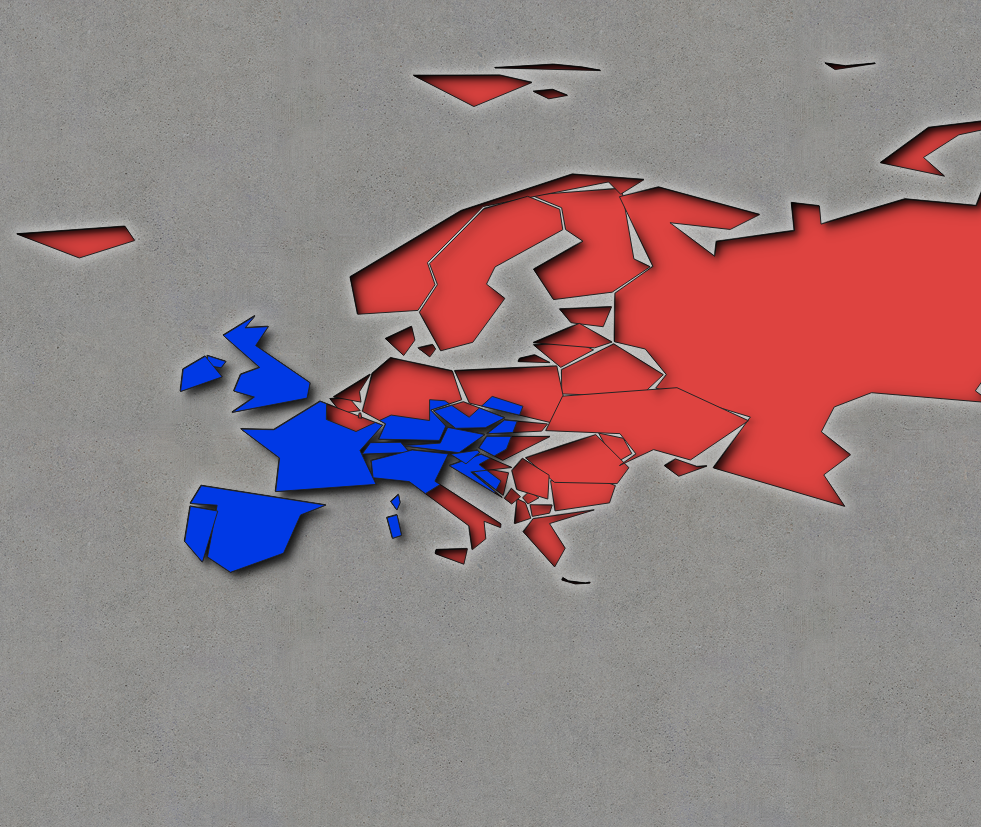
- 22 Boundaries: Inspired by Command and Conquer Red Alert. Background by Spiney (CC-BY 3.0 / CC-BY-SA 3.0, https://opengameart.org/node/12098)
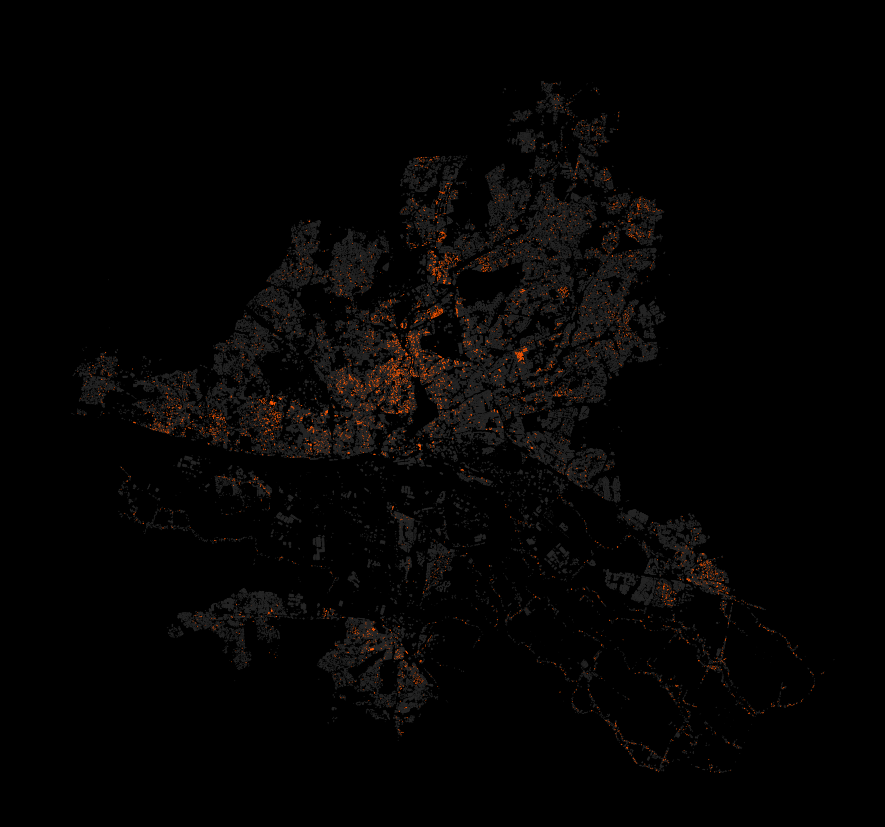
- 24 Historical: Buildings in Hamburg that were built before the war (at least to some not so great dataset). Data Lizenz: Datenlizenz Deutschland Namensnennung 2.0 (Freie und Hansestadt Hamburg, Landesbetrieb Geoinformation und Vermessung (LGV))
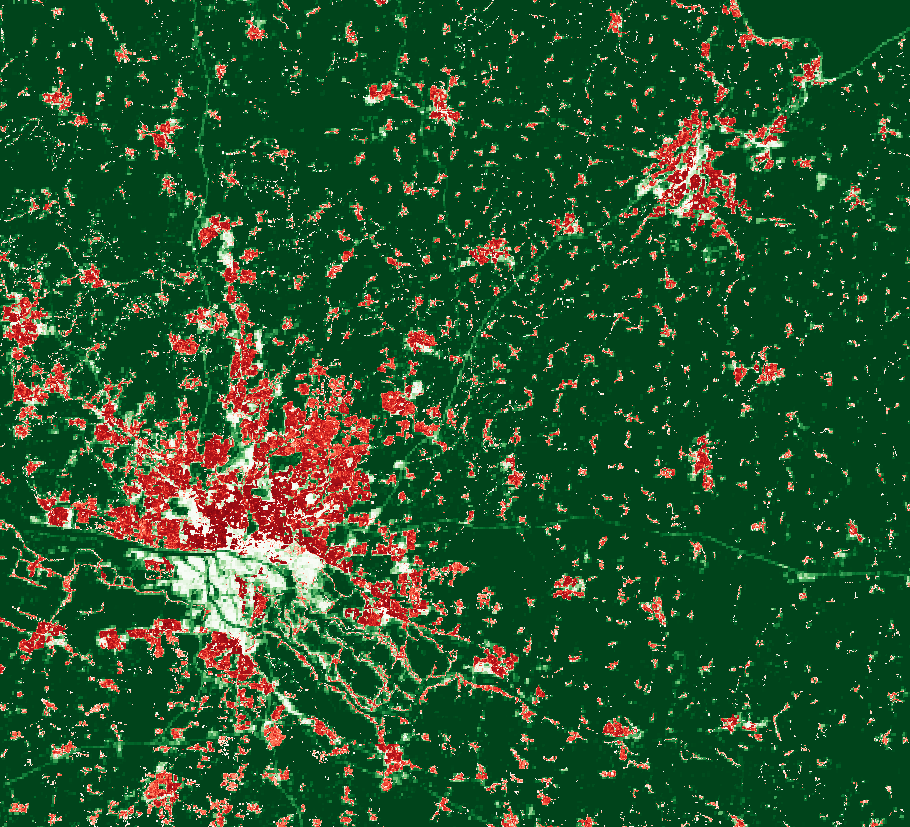
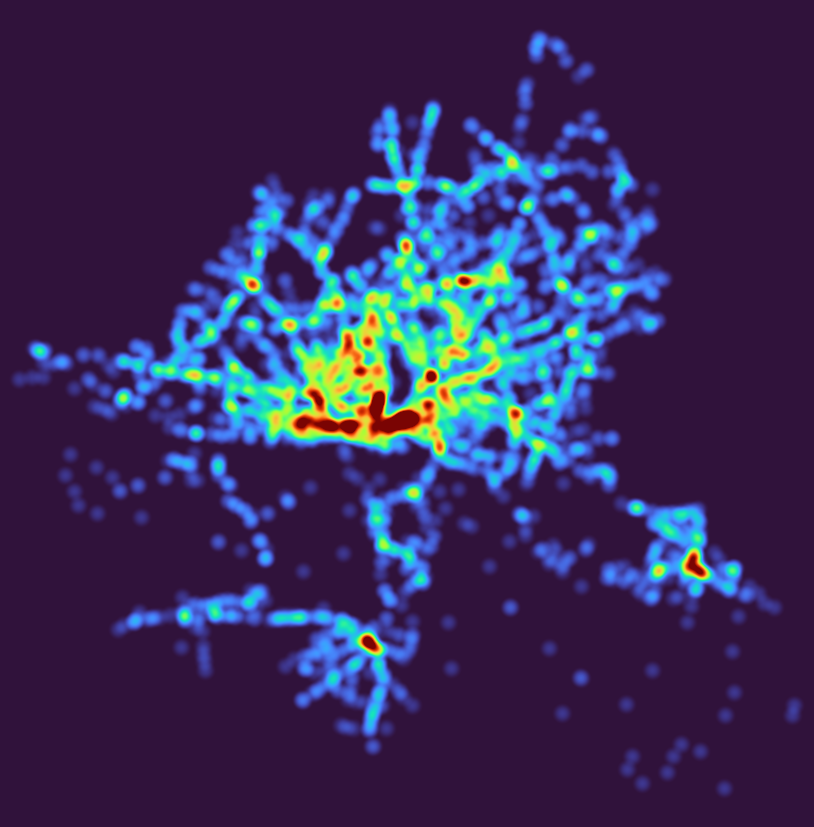
- 27 Heatmap: Outdoor advertisements (or something like that) in Hamburg. Fuck everything about that! Data Lizenz: Datenlizenz Deutschland Namensnennung 2.0 (Freie und Hansestadt Hamburg, Behörde für Verkehr und Mobilitätswende, (BVM))
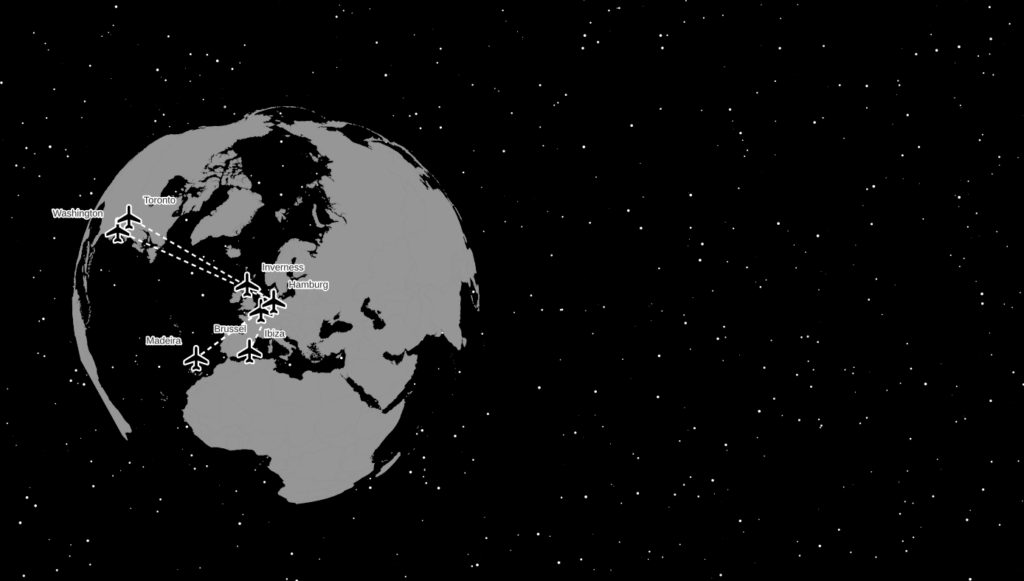
- 28 Earth not flat. Using my colleague’s Beeline plugin to create lines between the airports I have flown too and the Globe Builder plugin by @gispofinland to make a globe.
please i want to know how to make this video about lines
I used a DEM and river lines. Loaded in qgis2threejs and set the rivers to have a relative elevation above the DEM.