Author Archives: Hannes

Tracking deutscher Onlinemedien

Tracking deutscher Onlinemedien - 1

Weil ich jedes Mal das Würgen kriege, wenn Medienvertreter über die pösen pösen Ad-Blocker meckern und wie das Internet ohne Werbung keine Inhalte hätte. Weil es niemanden etwas angeht, wer, was, wann und wo liest. Weil ich https://pad.systemli.org/p/SSL-Zeitung eine tolle Initiative finde. Weil Gephi Spaß bringt. :)

Tracking deutscher Onlinemedien - lightbeamLightbeam for Firefox ist ein nettes Tool, um Verbindungen zwischen Webseiten zu tracken und visualisieren. Ich habe es installiert und rund 90 Internetauftritte zufälliger Zeitungen und Magazine aufgerufen (Liste am Ende dieses Beitrags). Ich habe dabei “klassische” Medien bevorzugt

YOU HAVE VISITED 92 SITEs
YOU HAVE CONNECTED WITH 260 THIRD PARTY SITEs

Yumm yumm! Leider ist der eingebaute Graph ziemlich hässlich und unübersichtlich. Daher habe ich die Daten exportiert, etwas umformatiert und in Gephi visualisiert.

In Lightbeam: “Save Data”. Es kommt eine lightbeamData.json-Datei raus. Diese hab ich dann (per Holzhammer) mit GNU/Linux-Bordmitteln bekämpft. Erst mit sed Zeilenumbrüche eingefügt, dann mit awk die interessanten Felder extrahiert, mit sed bereinigt und dann Duplikate entfernt:

sed 's/\],/\],\n/g' lightbeamData.json | awk -F "," '{print $1"\t"$2}' | sed 's/[\["]//g' | sort | uniq > lightbeamData.tsv

Um sie anschließend direkt in Gephi laden zu können, müssen die Spalten Titel haben. Also zum Beispiel einfach “source[TAB]target” in die erste Zeile einfügen.

In Gephi ist es dann eigentlich ganz einfach. Neues Projekt, Data Laboratory -> Import Spreadsheet. Die lightbeamData.tsv-Datei auswählen. Tab als Trennzeichen und als Edges-Tabelle laden. Next -> Finish, Fertig!

Im Overview unten auf das Label Attributes Icon klicken und “Id” auswählen, jetzt werden die Nodes beschriftet. Links bei Ranking (Degree) -> Label Size als maximale Größe zum Beispiel 2 auswählen. Mit einem der Slider unten kann man die gesamte Textgröße dynamisch ändern. Und dann mit den Layouts herumspielen. Um ein schönes Endprodukt zu bekommen ist Label Adjust ganz furchtbar toll (verfälscht aber natürlich vorherige Layout-Algorithmen). Per Mouseover kann man sich benachbarte Nodes anzeigen lassen. Da kommt dann zum Beispiel sowas bei raus:

Tracking deutscher Onlinemedien - 2

Tracking deutscher Onlinemedien - 3

Tracking deutscher Onlinemedien - bild

Tracking deutscher Onlinemedien - fb

Tracking deutscher Onlinemedien - kugel

Tracking deutscher Onlinemedien - nuggad

Tracking deutscher Onlinemedien - süddeutsche

Tracking deutscher Onlinemedien - yieldlab

Fazit: HTTP Switchboard oder Request Policy lohnen sich.

Die folgenden Domains wurden besucht:

http://www.aachener-zeitung.de
http://www.abendblatt.de
http://www.abendzeitung-muenchen.de
http://www.alfelder-zeitung.de
http://www.augsburger-allgemeine.de
http://www.badische-zeitung.de
http://www.badisches-tagblatt.de
http://www.berliner-kurier.de
http://www.berliner-zeitung.de
http://www.berlinonline.de
http://www.bild.de
http://www.bnn.de
http://www.braunschweiger-zeitung.de
http://www.bremer-nachrichten.de
http://www.bz-berlin.de
http://www.cellesche-zeitung.de
http://www.cn-online.de
http://www.derwesten.de
http://www.dewezet.de
http://www.dnn-online.de
http://www.donaukurier.de
http://www.echo-online.de
http://www.einbecker-morgenpost.de
http://www.express.de
http://www.faz.net
http://www.fr-online.de
http://www.freiepresse.de
http://www.freitag.de
http://www.general-anzeiger-bonn.de
http://www.goettinger-tageblatt.de
http://www.goslarsche.de
http://www.handelsblatt.com
http://www.haz.de
http://www.heute.de
http://www.hildesheimer-allgemeine.de
http://www.jungewelt.de
http://www.ln-online.de
http://www.lvz-online.de
http://www.lz-online.de
http://www.main-netz.de
http://www.mainpost.de
http://www.maz-online.de
http://www.mdr.de
http://www.merkur-online.de
http://www.mittelbayerische.de
http://www.mopo.de
http://www.morgenpost.de
http://www.morgenweb.de
http://www.mz-web.de
http://www.n-tv.de
http://www.ndr.de
http://www.neuepresse.de
http://www.neuewestfaelische.de
http://www.nordbayerischer-kurier.de
http://www.nordbayern.de
http://www.noz.de
http://www.nw-news.de
http://www.nwzonline.de
http://www.op-online.de
http://www.ostsee-zeitung.de
http://www.otz.de
http://www.prosieben.de
http://www.rhein-zeitung.de
http://www.rheinpfalz.de
http://www.rotenburger-rundschau.de
http://www.rp-online.de
http://www.saarbruecker-zeitung.de
http://www.schwaebische.de
http://www.schwarzwaelder-bote.de
http://www.spiegel.de
http://www.stern.de
http://www.stuttgarter-zeitung.de
http://www.sueddeutsche.de
http://www.suedkurier.de
http://www.swp.de
http://www.sz-online.de
http://www.tagesschau.de
http://www.tagesspiegel.de
http://www.taz.de
http://www.teckbote.de
http://www.thueringer-allgemeine.de
http://www.tz.de
http://www.volksstimme.de
http://www.wa.de
http://www.welt.de
http://www.weser-kurier.de
http://www.westfalen-blatt.de
http://www.wn.de
http://www.zeit.de

Heimlich versteckte Randnotizen:
Ja, ich habe die “guten” Seiten ignoriert, die sich ausserhalb der Spaghettibälle befinden. In Lightbeam waren dies: rotenburger-rundschau.de, einbecker-morgenpost.de, bremer-nachrichten.de, alfelder-zeitung.de, jungewelt.de, neuewestfaelische.de.

Da ich einige Domains direkt im Router blocke könnte die Wirklichkeit noch schlimmer aussehen.

Ich habe das Gefühl, dass Lightbeam mehr Verbindungen suggeriert/erzeugt, als tatsächlich anfallen…

Shutting down the operating system by playing a “kill song” in MPD

I use a 20€ Dockstar with Archlinux ARM on it as MPD music server. Since I like to turn off electronic devices when they are not needed and pulling the plug is not something you should do to running computers, I was looking for a solution to somehow shut it down from any mpd client. So I added a specific song as “shutdown file”. Once that song is played, the system will cleanly shut down and power off.

Here is the systemd .service file I came up with:

# cat /etc/systemd/system/mpdtosystemshutdown.service
[Unit]
Description=MPD to system shutdown

[Service]
ExecStart=/bin/sh -c "sleep 10 && /usr/bin/inotifywait -e open /path/to/path/music/shutdown.mp3 && mpc clear && shutdown -h now"

[Install]
WantedBy=multi-user.target

You need: inotify-tools and mpc (in addition to mpd)

  1. The service sleeps for 10 seconds in the beginning because I keep the music on an external USB harddisk which gets mounted after the multi-user target is reached. This is an ugly workaround but should be good enough. A better solution would be using a udev rule or systemd mount unit to only start the service when the harddisk is mounted.
  2. Then inotifywait will monitor shutdown.mp3 for being opened by mpd (or anything else). Once this happens inotifywait will quit successfully.
  3. mpc will clear the mpd playlist as you do not want shutdown.mp3 to be played again right after booting, do you? I surely did not.
  4. Finally the system is being shut down and powered off.

You probably have to add shutdown.mp3 to your mpd database before starting this service or the database update might trigger it. Updating the database afterwards is save and does not trigger the shutdown.

Don’t blame me if this ends up with an infinite reboot loop.

Taxi trips in NYC

http://chriswhong.com/open-data/foil_nyc_taxi/ released a great dataset on taxi trips in NYC which he got through FOIL. The files are distributed rather inefficiently and without checksums so here is what I felt was missing.

I mirrored the files at https://archive.org/details/nycTaxiTripData2013 and added much smaller 7z files.

MD5 checksums of the original zip files:
16d7ea9735fc8806f2cba51e95f96c4b trip_data_1.csv.zip
5933a699bf289ec53de83970fcb7b4f6 trip_data_2.csv.zip
daed88fc85b71f4d36fe798edc938223 trip_data_3.csv.zip
a7d1a1ec83c95686d22e06b8668f938c trip_data_4.csv.zip
1421686e977907ab5566766660783742 trip_data_5.csv.zip
c5a6c614decd607f38686ea3a7f8a429 trip_data_6.csv.zip
73eebfd6dc7906f2bc758a4d4859ff9b trip_data_7.csv.zip
1ff1ffc336eb6517bc44cce25498eae6 trip_data_8.csv.zip
6eebd8c46ed66ad73b59f3f1445b8200 trip_data_9.csv.zip
052d12e2f9a825563b20e748da257845 trip_data_10.csv.zip
3df0f8292ee92bb0c96145b6f9069c3d trip_data_11.csv.zip
1c5a3a9353e7192a4cf32273bbd1458a trip_data_12.csv.zip
a3b8a092f9062c0431ea40031f2faf03 trip_fare_1.csv.zip
b1fe72a3bbd884e58618657c8150b179 trip_fare_2.csv.zip
d44fde041b643b05da799f3f60880690 trip_fare_3.csv.zip
8566bbb0084044139ac5ff125bc8c45a trip_fare_4.csv.zip
cebe886d4f8e6ef4a02c0453ade714d6 trip_fare_5.csv.zip
b39c3de4825a2e0199771d3499133773 trip_fare_6.csv.zip
b6660dbf87138bc1a03f78c892d2f150 trip_fare_7.csv.zip
e457df4423e910968e9cb0c437e89390 trip_fare_8.csv.zip
f300ff601fdfb8b08fce7165c598029d trip_fare_9.csv.zip
1f54ecba09415ab62ad4c2e2dbed8122 trip_fare_10.csv.zip
505e5b5da25abb0b30de4ab548b22714 trip_fare_11.csv.zip
af54f05a09540685e143f0f362f167ba trip_fare_12.csv.zip

MD5 checksums of the extracted files:
cb4cbb58fd0a679c2cc8b54e6b122752 trip_data_1.csv
6a23454e051bc791b5e9191e231623c6 trip_data_2.csv
c56b41f57cdeebf3f048bbd5b2cb0b22 trip_data_3.csv
d8d58033dfaeaaac4d9b0c4c2db65392 trip_data_4.csv
f3760655c5a86660e3da7689ab1a4d36 trip_data_5.csv
6ead7e108720ef7e5d42401e2e24446a trip_data_6.csv
5029e89ca6a4b9e1c5f7e41f7d9be7f7 trip_data_7.csv
0ba05fc2d13d1c565dc855a335204e59 trip_data_8.csv
266e326535f704a43c4d27f599599a3a trip_data_9.csv
484062a41cdf77a560ac22689e178dd9 trip_data_10.csv
82d1871807bfa0317dc6a655fa2e0e60 trip_data_11.csv
622bf18954cfa28c8dad4275163d437c trip_data_12.csv
8de2725ae9ebd0716c79a00cd7152f75 trip_fare_1.csv
e7a7b8c68dc752e1af1aa1338f6300e7 trip_fare_2.csv
ca76bfdf5216db38c2a632ed55b88a51 trip_fare_3.csv
c52e5ac23011c6e10ffa22601782a025 trip_fare_4.csv
f260ff7a0c97d023ff74a35ee21ee74c trip_fare_5.csv
a0080a3d6003aa1b67bea5efc0377c84 trip_fare_6.csv
588cce29ab1ff422770dd45c07afabad trip_fare_7.csv
ad3cc028b12dab8b20fbffcd75523db5 trip_fare_8.csv
af53ca5f2a6c517a3066ee8dadeb72b7 trip_fare_9.csv
c7c57109241825128781eb3b9968c689 trip_fare_10.csv
e9ce76ebbe19ce786e2cc378fe97bbb6 trip_fare_11.csv
1b6579fc2dad108ac27a1ce1b6c6d9b6 trip_fare_12.csv

The original release was csv files inside zip files inside a zip file. I extracted them and used the free 7-zip to compress. The results are much smaller. The original zip file for the trip data is 11 gigabytes, the 7z archive is 3.9 gigabytes. The original zip file for the fare data is 7.7 gigabytes, the 7z archive is 1.7 gigabytes. I also tried bzip2 but it was not as efficient.

MD5 checksums of the 7z files:
f03d0a7749f44db2a8999cc592e2c828 trip_data.7z
52cf3fdfc2af2705db40fc1cd5d6b079 trip_fare.7z

I planned to simply color the “pickup” and “dropoff” locations in different colors but of course the Mapbox media machine beat me to it by a long shot. See eg https://twitter.com/enf/status/479402050497691649 and the gorgeous https://twitter.com/enf/status/479689969590472704. Stay tuned for a epileptic CartoDB Torque flicker tomorrow I guess. ;)

WFS zu Shapefiles

Hier mal als Beispiel mit wget, grep, sed und ogr2ogr (von GDAL/OGR) in der Bash. Diese Anleitung geht davon aus, dass die Titel der Layer keine Sonderzeichen enthalten, also einfach in der Shell und als Dateinamen verwendet werden können. Generell nicht elegant, aber funktioniert meistens.

WFS finden, zum Beispiel über http://hmdk.de/freitextsuche?action=doSearch&q=wfs. Hier nehme ich einfach mal http://gateway.hamburg.de/OGCFassade/DE_HH_WFS_INSPIRE_A1_4_Verwaltungseinheiten.aspx?REQUEST=GetCapabilities&SERVICE=WFS&VERSION=1.1.0 als Beispiel.

Capabilities abfragen:

wget -O DE_HH_WFS_INSPIRE_A1_4_Verwaltungseinheiten.GetCapabilities.xml http://gateway.hamburg.de/OGCFassade/DE_HH_WFS_INSPIRE_A1_4_Verwaltungseinheiten.aspx?REQUEST=GetCapabilities&SERVICE=WFS&VERSION=1.1.0

Verfügbare Layertitel extrahieren:

grep “<wfs:Title>” DE_HH_WFS_INSPIRE_A1_4_Verwaltungseinheiten.GetCapabilities.xml | grep -Eo ‘>.*<‘ | sed ‘s/[<>]//g’ > DE_HH_WFS_INSPIRE_A1_4_Verwaltungseinheiten.wfsTitle

Das sind dann zum Beispiel:

Hafengebietsgrenzen
Stadtteile
Bezirk
Ortsteile

Layer runterladen:

while read title; do wget -O DE_HH_WFS_INSPIRE_A1_4_Verwaltungseinheiten-${title}.gml "http://gateway.hamburg.de/OGCFassade/DE_HH_WFS_INSPIRE_A1_4_Verwaltungseinheiten.aspx?REQUEST=GetFeature&SERVICE=WFS&VERSION=1.1.0&typeName="${title}; done < DE_HH_WFS_INSPIRE_A1_4_Verwaltungseinheiten.wfsTitle

GML in Shapefile umwandeln:

while read title; do ogr2ogr -a_srs "EPSG:25832" -f "ESRI Shapefile" -fieldTypeToString IntegerList,StringList DE_HH_WFS_INSPIRE_A1_4_Verwaltungseinheiten-${title}.shp DE_HH_WFS_INSPIRE_A1_4_Verwaltungseinheiten-${title}.gml; done < DE_HH_WFS_INSPIRE_A1_4_Verwaltungseinheiten.wfsTitle

Open Data Hackathon 2014

Am Samstag war ich auf dem Open Data Hackathon in Hamburg mit dabei. Es war klasse! Hier ein kleiner Bericht, was ich gemacht habe.

Im Etherpad zur Veranstaltung hatte ich im Vorfeld einige Ideen gepostet und dabei auch auf meine (meiner Meinung nach nur halbfertige) Hamburg Gebäudealter Karte verlinkt, welche auf einem freien Gebäude-Datensatz des Hamburger LGV basiert. Die Resonanz darauf war sehr gut und so war klar, dass wir mit den Daten noch etwas machen würden.

Von Achim Tack kam die Idee die Untergeschosse, also die “Hamburger Unterwelt” zu mappen. Leider haben nur rund 10% der Gebäude im Datensatz entsprechende Attribute. Stattdessen wurden es dann die Obergeschosse. Gemeinsam mit Christina Elmer, Patrick Stotz und Serge (vergesse ich nicht jemanden?) entschieden wir über die Klasseneinteilung und die Farbgebung. Der Rest war mit Tilemill ein Kinderspiel. Hier ist unsere Karte der Obergeschosse in Hamburg.

geschosse_hh_k
geschosse_detail

Nach ihrem Baujahr (bzw der “ersten baulichen Veränderung des Gebäudes”) hatte ich die Gebäude schon im letzten Herbst eingefärbt, dann aber die letzten 5% nie fertiggestellt. Auf dem ODH habe ich dann einmal eine möglicherweise bessere Klassen-Einteilung ausprobiert (nach Gebäudealter gegoogelt und die Klassen aus irgendeiner Bewertungsrichtlinie übernommen). Heute gefallen mir meine alten Klassen doch besser, da sie die älteren Gebäude hervorheben. Also habe ich die Karte eben nochmal mit dem alten Stil neu gerendert, diesmal ohne die höchste Zoomstufe: Karte des Gebäudealters in Hamburg. Leider sind die Daten sehr unvollständig, teilweise fehlerhaft und darüber hinaus auch noch irreführend (Baujahr ist wohl mit der ältesten dokumentierten Einmessung einer baulichen Veränderung gleichgesetzt). Wer ist beim LGV eigentlich auf die Idee gekommen die Zahl 1500 als “ja keine Ahnung von wann das Gebäude ist” zu missbrauchen…? Diese Karte ist also wirklich nur als Kunst zu gebrauchen, nicht für ernstgemeinte Analysen. Ich habe es leider nicht geschafft die Attribute beim Mouseover zu zeigen.

baujahr_hh_k
baujahr_detail

Beide Karten haben natürlich das Problem, dass kleine Gebäude schlecht sichtbar sind und der Gesamteindruck den Betrachter dadurch teilweise in die Irre führt. Klassen lassen sich auch nur bedingt identifizieren. Egal, schön ist schön!

Zwischendurch überlegten wir, was wir mit den Gebäude-Daten noch anstellen könnten. Ich wurde mit den tollen Daten des Urban Atlas bekannt gemacht und Christina Elmer hatte eine wunderbare Idee, welche sofort das kreative Kopfkino angeschmissen hat. Darüber sage ich jetzt erstmal nicht mehr, da wir nebenbei daran basteln. :)

Fazit: Ein toller, inspirierender und produktiver Tag mit netten Leuten, interessanten Projekten und leckerem Essen (danke Marco!). Ich freue mich auf’s Wiedersehen und Weiterhacken. Wer hat Lust die übrigen Attribute der Gebäude zu visualisieren? Und warum nicht bestimmte Jahre (Nachkriegszeit) oder typische Gebäudetypen einzeln hervorheben?

Kuckt euch auch die andere Projekte an, im Hackdash zur Veranstaltung sind sie aufgelistet.

PS: Die Gebäudedaten kommen in einem GML-Format. Man kann sie mit QGIS öffnen, wenn man GDAL installiert hat. Mit GDAL kann man sie auch einfach in Shapefiles konvertieren, wobei dann natürlich die Attributsnamen gekürzt werden und doppelte Attribute zusammengefasst werden müssen:

ogr2ogr -a_srs "EPSG:25832" -f "ESRI Shapefile" \
-fieldTypeToString IntegerList,StringList \
"$(basename ${file} .xml)".shp "${file}" AX_Gebaeude

Ich habe sie als Shapefile hochgeladen: NAS_gebaeude.7z (keine Garantie usw.)

Illustrating map projection distortions with the outline of a human head

Browsing archive.org I came across the beautiful figures in Elements of map projection with applications to map and chart construction by Charles Henry Deetz and Oscar Sherman Adams from 1921. While thumbing through it is worthwhile in any case if you like cartography, one page surprised me with illustrations of relative distortions in map projections. They used the outline of a human head to show the distortion of globular, orthographic, stereographic and Mercator projection.

illustrations of relative distortions

It might be a fun project to make a website where random images could be distorted to various projections. mercator.me is taken.

Fuel prices in Germany: Collecting the data

Discontinued because I will be working on this data for my master thesis. I’ll try to post updates on that though.

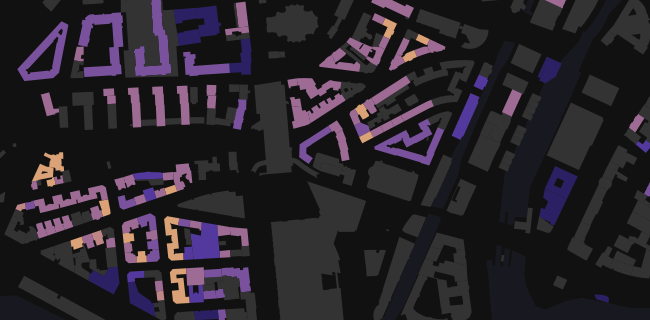
Recently the German government required all most fuel stations to report their prices to a central agency to control price fixing and enable the public to inform themselves. Right now the project is in a test phase. Unfortunately the data is not publicly shared with anyone but a selected few companies. The Telekom Tankstellen website is one resulting frontend to the data. But since the display options and graphical representation did not satisfy me, I just had to make my own map(s). Most importantly I wanted to see the variety of prices in the whole country at once.

In a short series of posts (maybe just two or three) I will show you how to acquire the data from the website, how to get it into a GIS usable format, how to make a map with it and maybe how to automate all of it with the goal of turning it into an animation. Let’s start with the data acquisition.

Scraping data

Prerequisites

  • A web browser that let’s you inspect network traffic. I use Opera 12, it has very nice developer tools. You could also use ngrep, tcpdump, wireshark or something similar but I find a web browser most convenient.
  • curl or wget
  • Bash or some other way of automating curl/wget
  • Some basic understanding of HTTP

Inspecting the website

tanken.telekom.map

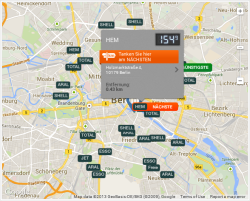
The Telekom Tankstellen website offers a search function where you can choose a type of fuel and a radius of up to 20 kilometers around a location in which you want it to return all fuel stations. There is an embedded map which shows the results with big brand labels while highlighting the nearest as well as the cheapest station in the area. When hovering the mouse pointer on the labels, the price is shown in a pop-up. Below the map is a list of all the affected stations, their brand, address and price.

Since the map is just an embedded dynamic Google map with custom markers you might already suspect that the raw coordinates of the stations are available to your web browser. Also note how the page does not reload if you make a new search, a great indicator for Ajax.

Enable your browser’s network monitor and reload the website. Now look through the list of requests. (In Opera you can easily filter by resource type, in this case you could filter for XHR.) You should see a file called search.xml. Inspect the details of that request.

opera network request

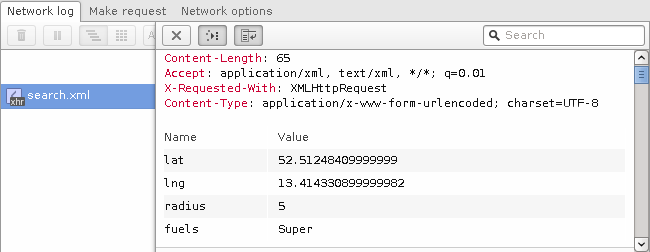
As you can see in the image above, the request is a HTTP POST to /api/v1/search.xml with the parameters lat, lng, radius and fuels.

The server’s response is an XML object showing you a multitude of information about the fuel stations:

<search>
  <gasStations type="Array">
    <gasStation
    ident="519b492fbed7139bf0d432c0"
    brand="HEM"
    name="Hem Berlin Holzmarktstraße"
    street="Holzmarktstraße 4"
    zip="10179"
    city="Berlin"
    lat="52.5147271"
    lng="13.4195317"
    highway="false"
    services="convenience_store,grocery_store"
    distance="0.431"
    is_open="true"
    >
  <openingTimes type="Array">
    (...)
  </openingTimes>
  <fuels type="Array">
    <fuel
    kind="Super"
    price="1.539"
    timestamp="1381593720">
    </fuel>
  </fuels>
</gasStation>
(...)

Excellent, we found the data source. If you were only interested in those selected few stations, you could just copy’n’paste the XML response but since our goal is to make a map of the whole country we need to be able to automate this data acquisition step for arbitrary coordinates.

With curl you can perform the request like this:

curl --data 'lat=52.5125&lng=13.4143&radius=5&fuels=super' http://tanken.t-online.de/api/v1/search.xml

By default curl will print the response to the terminal but you can tell it to save it to a file or alternatively just use wget instead.

I first tried if you could use a bigger radius than the 20 kilometers available on the website and yes, the maximum seems to be 50 kilometers. I also tried to find a way to make it return prices for all the fuel types but did not succeed. I could imagine that it would work if you pass them in a properly formatted array but poking around like that takes it too far in my opinion.

Performing a mass-scrape

Mass-scraping can be taxing to a service and is ethically questionable, so I will not share a snippet to copy and paste. If you decide to do it yourself, you will have to implement it yourself.

We can now download fuel stations within a radius of 50 kilometers around an arbitrary coordinate. So of course we can do that for many coordinates until we have complete coverage of Germany.

Roughly rounding the numbers the geographic extends of Germany are

     55.5 N
5.5 E    15.5 E
     47 N

tankstellen-circles

To fully cover an area with fixed size circles you can just put rows of circles into it, shifting each row by the radius of the circles. This will lead to quite some overlap but definitely cover all of it.

The problem here is that we specify coordinates in WGS84 (a geographic coordinate system) while the radius is specified in meters. The ratio between degrees and meters depends on the latitude: In the southern-most corner of Germany (~47° latitude) longitudes are 76 kilometers apart while in the north (~56° latitude) it is just 64 kilometers (Source). The distance between latitudes is always roughly 111 kilometers (Source).

tankstellen-circles-germany

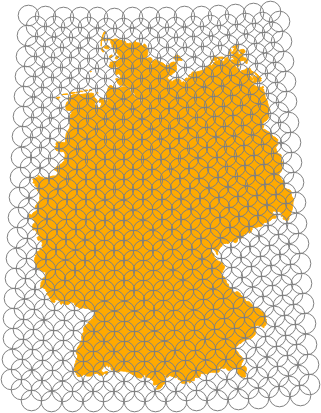
The maximum radius we can use is 50 kilometers. At 47° latitude this is 50/((2*pi*6371*cos(47*pi/180))/360) = 0.65°. So we can step by 0.65° in the west/east direction and shift 0.65°/2 = 0.32° sideways on subsequent (north/south) lines which themselves are 0.22° (50/112/2) apart. You can see the resulting increase of overlap towards the north in the image on the right.

You could load the resulting list of coordinates and remove the unnecessary ones with QGIS. Or alternatively download them all once, see which ones returned zero data and remove those coordinates. Either way, you can significantly reduce the number of requests to the website.

I used a bash script to perform all the resulting requests. If you do it yourself please consider adding a pause between requests and using a custom user-agent with your contact details in case the service administrators want to contact you. If you do this nicely and handle the resulting dataset responsibly, you should not have anything to worry about. But always keep in mind that you are accessing an API that was not likely published to be used like that.

Next: Turning the XML into a data format that you can easily load into QGIS.