Category Archives: guide

A bad map about gender differences in literacy

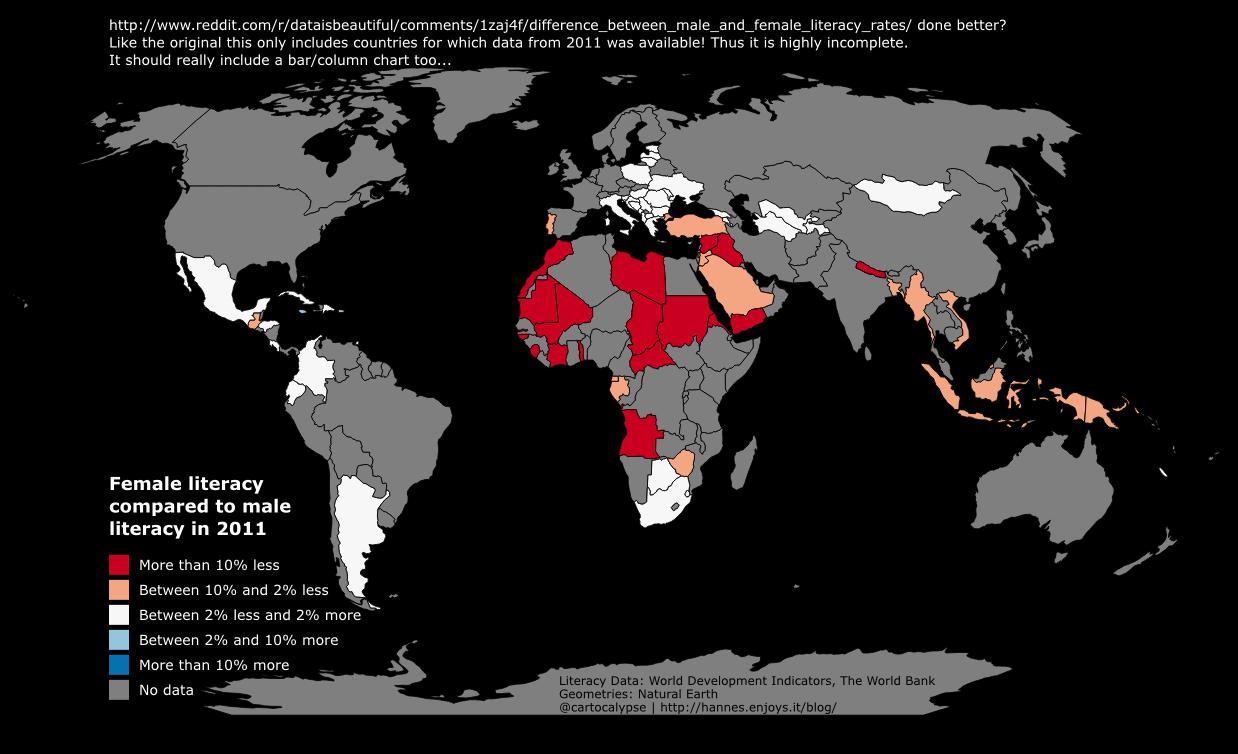
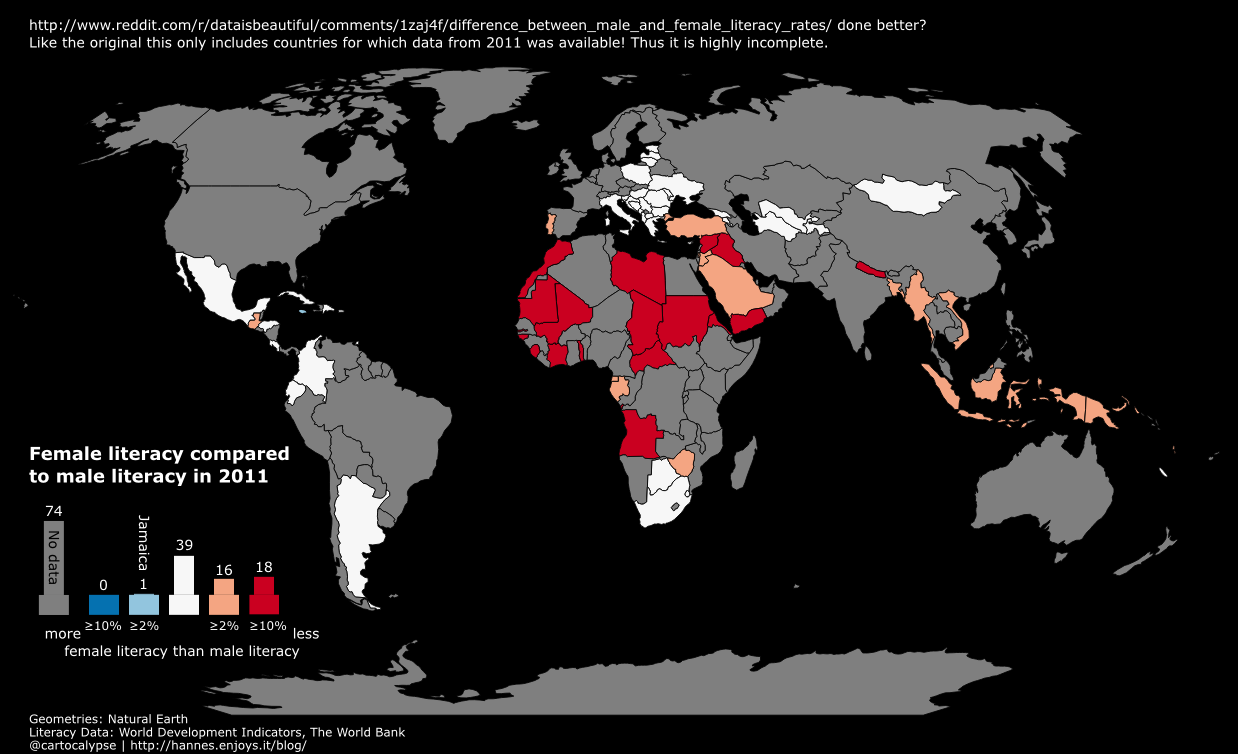
Wrote this in 2014, not sure why I did not publish it. It was a response to this bad map.

world bank 2011 female vs male literacy

No need for expensive software, you can use the free and open-source QGIS for this: https://qgis.org/

1. Install QGIS

2. Download and unzip the data http://databank.worldbank.org/data/download/WDI_excel.zip (not sure what license, they want attribution “World Development Indicators, The World Bank”)

3. Download and unzip country geometries http://www.naturalearthdata.com/http//www.naturalearthdata.com/download/50m/cultural/ne_50m_admin_0_countries.zip (public domain but be nice and add attribution “Geometries from Natural Earth”)

4. Open QGIS, Layer -> Add Vector Layer -> choose ne_50m_admin_0_countries.shp

5. Unfortunately the csv is not simple, it has more than one row per country as it includes time series. And it does not have the value we want to map precalculated.

Afghanistan,AFG,"Literacy rate, adult female (% of females ages 15 and above)",SE.ADT.LITR.FE.ZS,,,,,,,,,,,,,,,,,,,,4.98746100000000E+00,,,,,,,,,,,,,,,,,,,,,,,,,,,,,,,,,,
Afghanistan,AFG,"Literacy rate, adult male (% of males ages 15 and above)",SE.ADT.LITR.MA.ZS,,,,,,,,,,,,,,,,,,,,3.03077500000000E+01,,,,,,,,,,,,,,,,,,,,,,,,,,,,,,,,,,
Afghanistan,AFG,"Literacy rate, adult total (% of people ages 15 and above)",SE.ADT.LITR.ZS,,,,,,,,,,,,,,,,,,,,1.81576800000000E+01,,,,,,,,,,,,,,,,,,,,,,,,,,,,,,,,,,
Afghanistan,AFG,"Literacy rate, youth female (% of females ages 15-24)",SE.ADT.1524.LT.FE.ZS,,,,,,,,,,,,,,,,,,,,1.11428000000000E+01,,,,,,,,,,,,,,,,,,,,,,,,,,,,,,,,,,
Afghanistan,AFG,"Literacy rate, youth male (% of males ages 15-24)",SE.ADT.1524.LT.MA.ZS,,,,,,,,,,,,,,,,,,,,4.57960200000000E+01,,,,,,,,,,,,,,,,,,,,,,,,,,,,,,,,,,
Afghanistan,AFG,"Literacy rate, youth total (% of people ages 15-24)",SE.ADT.1524.LT.ZS,,,,,,,,,,,,,,,,,,,,3.00663500000000E+01,,,,,,,,,,,,,,,,,,,,,,,,,,,,,,,,,,

This step is probably the hardest. I will use some Unix tools as I am used to them and they work well. Sorry! You can probably do this with a good texteditor or spreadsheet application as well.

We have “csvcut -c 2 WDI_Data.csv | uniq | wc -l” -> 253 -> 252 country codes (without the header). We have 6 lines per country for the literacy data. We should have at max 252 unique values per field then. TheZeitgeist only used data from 2011.

To make it more convenient to work, I first split off the Literacy data into a new file with

head -n 1 WDI_Data.csv > Literacy.csv; grep Literacy WDI_Data.csv >> Literacy.csv

No idea if TheZeitgeist mixed Adult and Youth, let’s just use the Adult data for now.

head -n 1 WDI_Data.csv > Literacy_adult.csv; grep -E "Literacy rate, adult (fe)*male" Literacy.csv >> Literacy_adult.csv

Next let’s isolate the data for 2011. csvcut seems to have a bug with numerically named columns so we have to use the field’s index (56) instead of its name “2011”.

csvcut -c 2,3,56 Literacy_adult.csv > Literacy_adult_2011.csv

We need to get the data into one line per country, I am lazy so:

grep "Literacy rate, adult female" Literacy_adult_2011.csv > Literacy_adult_2011_female.csv
grep "Literacy rate, adult male" Literacy_adult_2011.csv | sed 's/.*15 and above)",/,/' > Literacy_adult_2011_male.csv
echo "Country Name,Country Code, Literacy Female, Literacy Male" > Literacy_adult_2011_oneline.csv; paste -d "" Literacy_adult_2011_female.csv Literacy_adult_2011_male.csv >> Literacy_adult_2011_oneline.csv

Enough of that commandline mumbojumbo! QGIS time!

Natural Earth has a column named “wb_a3” which is the WB 3 letter country codes, yay!

toreal("Literacy_adult_2011_oneline_Literacy Female") - toreal("Literacy_adult_2011_oneline_Literacy Male")

Figure out the rest yourself. This is where I apparently lost interest in writing back then. ;)
—–

Now make the map better by choosing a projection that does not make Greenland as big as Africa. Also, I would try adding another “attribute” to the display, change the alpha value depending on the absolute literacy.

And finally realise that a map is not a good visualisation because you cannot see the values of tiny countries. Make a bar chart instead. ;)

world bank 2011 female vs male literacy plus bar

ffmpeg on raspbian / Raspberry Pi

Since http://www.jeffreythompson.org/blog/2014/11/13/installing-ffmpeg-for-raspberry-pi/ is a bit messy, here is how you can compile ffmpeg with x264 on raspbian. Changes are building in your home directory, getting just a shallow git clone and building with all CPU cores. Also no unnecessary sudo…

Read the comments below!

# In a directory of your choosing (I used ~/ffmpeg):

# build and install x264
git clone --depth 1 git://git.videolan.org/x264
cd x264
./configure --host=arm-unknown-linux-gnueabi --enable-static --disable-opencl
make -j 4
sudo make install
 
# build and make ffmpeg
git clone --depth=1 git://source.ffmpeg.org/ffmpeg.git
cd ffmpeg
./configure --arch=armel --target-os=linux --enable-gpl --enable-libx264 --enable-nonfree
make -j4
sudo make install

Read the comments below!

Hopefully someone, somewhere will provide a repository for this kind of stuff some day.

It takes just 25 minutes on a Raspberry Pi 3. Not hours or days like some old internet sources on old Raspis say.

In case you are wondering v4l2 should work with this.

Properly splitting a file at specific intervals with ffmpeg

Ever wanted to split a media file (video, audio, both) into segments of 10 minutes or something like that? The internet is full of terrible hacks and shitty Stack Overflow answers for this. So here is how you easily, properly split a file into same-length segments with ffmpeg.

-f segment -segment_time SECONDS fileprefix%04d.ext

Done. segment_time takes seconds as argument. For example:

ffmpeg -i recording.opus -c:a libvorbis -f segment -segment_time 3600 recording_%04d.ogg

or

ffmpeg -i huge.wav -c:a copy -f segment -segment_time 600 huge-%04d.flac

Not so hard, is it?

WFS zu Shapefiles

Hier mal als Beispiel mit wget, grep, sed und ogr2ogr (von GDAL/OGR) in der Bash. Diese Anleitung geht davon aus, dass die Titel der Layer keine Sonderzeichen enthalten, also einfach in der Shell und als Dateinamen verwendet werden können. Generell nicht elegant, aber funktioniert meistens.

WFS finden, zum Beispiel über http://hmdk.de/freitextsuche?action=doSearch&q=wfs. Hier nehme ich einfach mal http://gateway.hamburg.de/OGCFassade/DE_HH_WFS_INSPIRE_A1_4_Verwaltungseinheiten.aspx?REQUEST=GetCapabilities&SERVICE=WFS&VERSION=1.1.0 als Beispiel.

Capabilities abfragen:

wget -O DE_HH_WFS_INSPIRE_A1_4_Verwaltungseinheiten.GetCapabilities.xml http://gateway.hamburg.de/OGCFassade/DE_HH_WFS_INSPIRE_A1_4_Verwaltungseinheiten.aspx?REQUEST=GetCapabilities&SERVICE=WFS&VERSION=1.1.0

Verfügbare Layertitel extrahieren:

grep “<wfs:Title>” DE_HH_WFS_INSPIRE_A1_4_Verwaltungseinheiten.GetCapabilities.xml | grep -Eo ‘>.*<‘ | sed ‘s/[<>]//g’ > DE_HH_WFS_INSPIRE_A1_4_Verwaltungseinheiten.wfsTitle

Das sind dann zum Beispiel:

Hafengebietsgrenzen
Stadtteile
Bezirk
Ortsteile

Layer runterladen:

while read title; do wget -O DE_HH_WFS_INSPIRE_A1_4_Verwaltungseinheiten-${title}.gml "http://gateway.hamburg.de/OGCFassade/DE_HH_WFS_INSPIRE_A1_4_Verwaltungseinheiten.aspx?REQUEST=GetFeature&SERVICE=WFS&VERSION=1.1.0&typeName="${title}; done < DE_HH_WFS_INSPIRE_A1_4_Verwaltungseinheiten.wfsTitle

GML in Shapefile umwandeln:

while read title; do ogr2ogr -a_srs "EPSG:25832" -f "ESRI Shapefile" -fieldTypeToString IntegerList,StringList DE_HH_WFS_INSPIRE_A1_4_Verwaltungseinheiten-${title}.shp DE_HH_WFS_INSPIRE_A1_4_Verwaltungseinheiten-${title}.gml; done < DE_HH_WFS_INSPIRE_A1_4_Verwaltungseinheiten.wfsTitle

Fuel prices in Germany: Collecting the data

Discontinued because I will be working on this data for my master thesis. I’ll try to post updates on that though.

Recently the German government required all most fuel stations to report their prices to a central agency to control price fixing and enable the public to inform themselves. Right now the project is in a test phase. Unfortunately the data is not publicly shared with anyone but a selected few companies. The Telekom Tankstellen website is one resulting frontend to the data. But since the display options and graphical representation did not satisfy me, I just had to make my own map(s). Most importantly I wanted to see the variety of prices in the whole country at once.

In a short series of posts (maybe just two or three) I will show you how to acquire the data from the website, how to get it into a GIS usable format, how to make a map with it and maybe how to automate all of it with the goal of turning it into an animation. Let’s start with the data acquisition.

Scraping data

Prerequisites

  • A web browser that let’s you inspect network traffic. I use Opera 12, it has very nice developer tools. You could also use ngrep, tcpdump, wireshark or something similar but I find a web browser most convenient.
  • curl or wget
  • Bash or some other way of automating curl/wget
  • Some basic understanding of HTTP

Inspecting the website

tanken.telekom.map

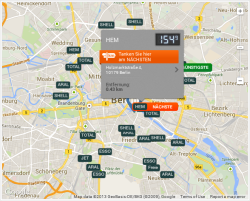
The Telekom Tankstellen website offers a search function where you can choose a type of fuel and a radius of up to 20 kilometers around a location in which you want it to return all fuel stations. There is an embedded map which shows the results with big brand labels while highlighting the nearest as well as the cheapest station in the area. When hovering the mouse pointer on the labels, the price is shown in a pop-up. Below the map is a list of all the affected stations, their brand, address and price.

Since the map is just an embedded dynamic Google map with custom markers you might already suspect that the raw coordinates of the stations are available to your web browser. Also note how the page does not reload if you make a new search, a great indicator for Ajax.

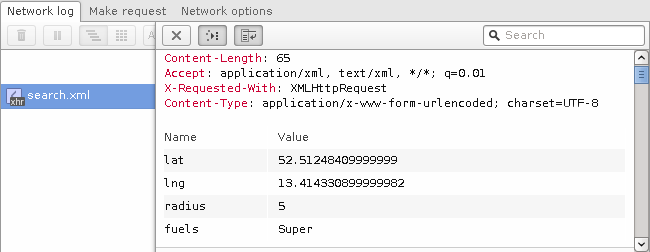
Enable your browser’s network monitor and reload the website. Now look through the list of requests. (In Opera you can easily filter by resource type, in this case you could filter for XHR.) You should see a file called search.xml. Inspect the details of that request.

opera network request

As you can see in the image above, the request is a HTTP POST to /api/v1/search.xml with the parameters lat, lng, radius and fuels.

The server’s response is an XML object showing you a multitude of information about the fuel stations:

<search>
  <gasStations type="Array">
    <gasStation
    ident="519b492fbed7139bf0d432c0"
    brand="HEM"
    name="Hem Berlin Holzmarktstraße"
    street="Holzmarktstraße 4"
    zip="10179"
    city="Berlin"
    lat="52.5147271"
    lng="13.4195317"
    highway="false"
    services="convenience_store,grocery_store"
    distance="0.431"
    is_open="true"
    >
  <openingTimes type="Array">
    (...)
  </openingTimes>
  <fuels type="Array">
    <fuel
    kind="Super"
    price="1.539"
    timestamp="1381593720">
    </fuel>
  </fuels>
</gasStation>
(...)

Excellent, we found the data source. If you were only interested in those selected few stations, you could just copy’n’paste the XML response but since our goal is to make a map of the whole country we need to be able to automate this data acquisition step for arbitrary coordinates.

With curl you can perform the request like this:

curl --data 'lat=52.5125&lng=13.4143&radius=5&fuels=super' http://tanken.t-online.de/api/v1/search.xml

By default curl will print the response to the terminal but you can tell it to save it to a file or alternatively just use wget instead.

I first tried if you could use a bigger radius than the 20 kilometers available on the website and yes, the maximum seems to be 50 kilometers. I also tried to find a way to make it return prices for all the fuel types but did not succeed. I could imagine that it would work if you pass them in a properly formatted array but poking around like that takes it too far in my opinion.

Performing a mass-scrape

Mass-scraping can be taxing to a service and is ethically questionable, so I will not share a snippet to copy and paste. If you decide to do it yourself, you will have to implement it yourself.

We can now download fuel stations within a radius of 50 kilometers around an arbitrary coordinate. So of course we can do that for many coordinates until we have complete coverage of Germany.

Roughly rounding the numbers the geographic extends of Germany are

     55.5 N
5.5 E    15.5 E
     47 N

tankstellen-circles

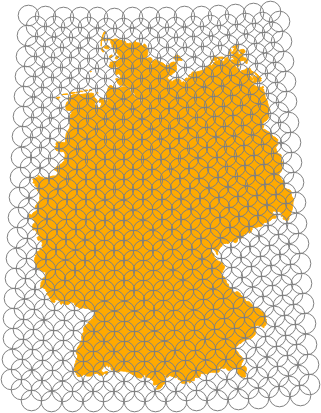
To fully cover an area with fixed size circles you can just put rows of circles into it, shifting each row by the radius of the circles. This will lead to quite some overlap but definitely cover all of it.

The problem here is that we specify coordinates in WGS84 (a geographic coordinate system) while the radius is specified in meters. The ratio between degrees and meters depends on the latitude: In the southern-most corner of Germany (~47° latitude) longitudes are 76 kilometers apart while in the north (~56° latitude) it is just 64 kilometers (Source). The distance between latitudes is always roughly 111 kilometers (Source).

tankstellen-circles-germany

The maximum radius we can use is 50 kilometers. At 47° latitude this is 50/((2*pi*6371*cos(47*pi/180))/360) = 0.65°. So we can step by 0.65° in the west/east direction and shift 0.65°/2 = 0.32° sideways on subsequent (north/south) lines which themselves are 0.22° (50/112/2) apart. You can see the resulting increase of overlap towards the north in the image on the right.

You could load the resulting list of coordinates and remove the unnecessary ones with QGIS. Or alternatively download them all once, see which ones returned zero data and remove those coordinates. Either way, you can significantly reduce the number of requests to the website.

I used a bash script to perform all the resulting requests. If you do it yourself please consider adding a pause between requests and using a custom user-agent with your contact details in case the service administrators want to contact you. If you do this nicely and handle the resulting dataset responsibly, you should not have anything to worry about. But always keep in mind that you are accessing an API that was not likely published to be used like that.

Next: Turning the XML into a data format that you can easily load into QGIS.