Recorded by placing two windows side by side and zoom into separate, non-cached regions using:"xte "mousemove 640 440" "mouseclick 4" && xte "mousemove 1080 440" "mouseclick 4" in a loop.
Category Archives: small things
Your own little internet speed monitor
I wanted to monitor my ISP’s service over time and could not find any available simple tool for that. The usual system monitoring tools are usually displaying averages, not min/max values. So I used WD40 (speedtest-cli) and duct tape (cron) to make my own.
You need to have a cron daemon set up and speedtest-cli installed.
Then prepare an empty csv file with a header like this (don’t forget a trailing newline!) and store it in a path of your choice:
Server ID,Sponsor,Server Name,Timestamp,Distance,Ping,Download,Upload,Share,IP Address
Set up a cronjob at an interval of your choice (don’t be a dick) to run a speed test and log the results to the csv file:
@hourly speedtest --csv >> /home/user/path/to/speedtest.csvIf you have a fast connection you might spot slow test servers that would badly bias your results, so exclude them using the --exclude option if necessary.
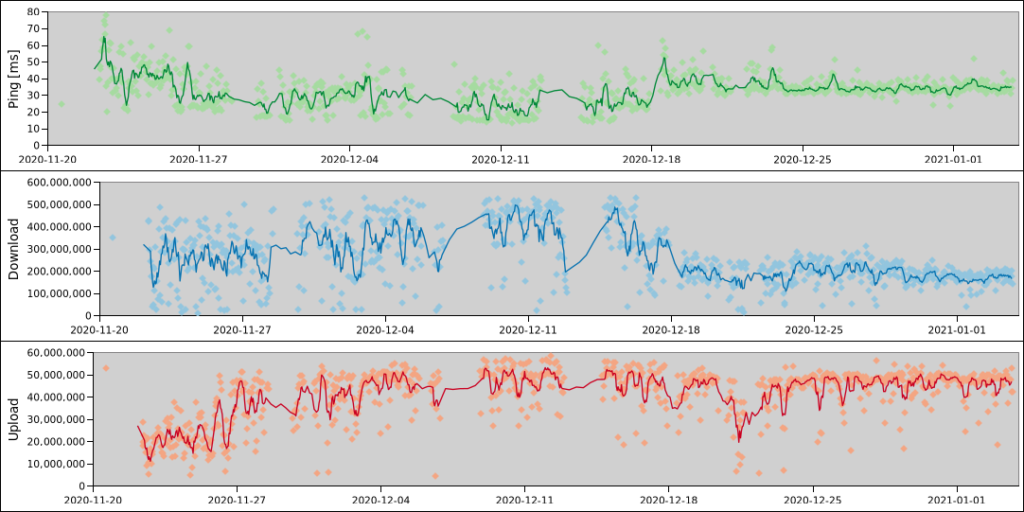
That’s all, you get a nice log of internet ping, upload and download speeds, ready to be visualized in your software of choice (like the best spreadsheet software in existence). I will have to complain to my ISP for that drop since mid December for sure:

And now that I have written this, I realise that for plotting I could also just use a min/max function for a moving time window in Grafana I guess? The speedtests would still be triggered and provide nice bursts of usage. Anyone got pointers on how to do that?
Finding the most popular reaction in Slack
This can be run against a Slack export. It will count the reactions used and display them in an ordered list. Written for readability not speed or efficiency. No guarantees that this isn’t terribly broken. Enjoy and use responsibly!
import json
import glob
import collections

# collect messages
messages = []
for filename in glob.glob('*/*.json'):
    with open(filename) as f:
        messages += json.load(f)

# extract reactions
reactions = []
for message in messages:
    if "reactions" in message:
        reactions += message["reactions"]

# count reactions
reaction_counter = collections.Counter()
for reaction in reactions:
    reaction_counter.update({reaction["name"]: reaction["count"]})

# done, print them
print(reaction_counter.most_common())Brother DCP-L2530DW printer/scanner on Archlinux
Connect your Brother DCP-L2530DW to your WLAN/Wifi network. Find the printer’s IP (make sure it is static, e. g. by setting it up accordingly in your router). Adjust the IP in the lines below.
Scanning
Install brscan4 and xsane.
As root run: brsaneconfig4 -a name="DCP-L2530DW" model="DCP-L2530DW" ip=192.168.1.123
Printing
Install cups.
As root run: lpadmin -p DCP-L2530DW-IPPeverywhere -E -v "ipp://192.168.1.123/ipp/print" -m everywhere
And you are ready to go, enjoy!
PS: If you change the IP, you might need to edit /etc/opt/brother/scanner/brscan5/brsanenetdevice.cfg and /etc/cups/printers.conf.
For printing via USB (e.g. because you don’t want to have a 2.4GHz network anymore but this sad printer supports no 5GHz), simply install brother-dcp-l2530dw from AUR, “find new printers” in CUPS and add it.
Das eigene kleine Deutschlandradio Archiv
Mediatheken des Öffentlich-rechtlichen Rundfunks müssen wegen asozialen Arschlöchern ihre Inhalte depublizieren. Wegen anderer Arschlöcher sind die Inhalte nicht konsequent unter freien Lizenzen, aber das ist ein anderes Thema.
Ich hatte mir irgendwann mal angesehen, was es eigentlich für ein Aufwand wäre, die Inhalte verschiedener Mediatheken in ein privates Archiv zu spiegeln. Mit dem Deutschlandradio hatte ich angefangen und mit den üblichen Tools täglich die neuen Audiobeiträge in ein Google Drive geschoben. Dieses Setup läuft jetzt seit mehr als 2 Jahren ohne Probleme und vielleicht hat ja auch wer anders Spaß dran:
Also:
- rclone einrichten oder mit eigener Infrastruktur arbeiten (dann die rclone-Zeile mit z.B. rsync ersetzen)
- <20 GB Platz haben
- Untenstehendes Skript als täglichen Cronjob einrichten (und sich den Output zu mailen lassen)
#!/bin/bash

# exit if anything fails
# not a good idea as downloads might 404 :D
set -e

cd /home/dradio/deutschlandradio

# get all available files
wget -nv -nc -x "http://srv.deutschlandradio.de/aodlistaudio.1706.de.rpc?drau:page="{0..100}"&drau:limit=1000"
grep -hEo 'http.*mp3' srv.deutschlandradio.de/* | sort | uniq > urls

# check which ones are new according to the list of done files
comm -13 urls_done urls > todo

numberofnewfiles=$(wc -l todo | awk '{print $1}')
echo "${numberofnewfiles} new files"

if (( numberofnewfiles < 1 )); then
        echo "exiting"
        exit
fi

# get the new ones
echo "getting new ones"
wget -i todo -nv -x -nc || echo "true so that set -e does not exit here :)"
echo "new ones downloaded"

# copy them to remote storage
rclone copy /home/dradio_scraper/deutschlandradio remote:deutschlandradio && echo "rclone done"

## clean up
# remove files
echo "cleaning up"
rm -r srv.deutschlandradio.de/
rm -rv ondemand-mp3.dradio.de/
rm urls

# update list of done files
cat urls_done todo | sort | uniq > /tmp/urls_done
mv /tmp/urls_done urls_done

# save todo of today
mv todo urls_$(date +%Y%m%d)

echo "done"
Pro Tag sind es so 2-3 Gigabyte neuer Beiträge.
In zwei Jahren sind rund 2,5 Terabyte zusammengekommen und ~300.000 Dateien, aber da sind eventuell auch die Seiten des Feeds mitgezählt worden und Beiträge, die schon älter waren.
Wer mehr will nimmt am besten direkt die Mediathekview-Datenbank als Grundlage.
Nächster Schritt wäre das eigentlich auch täglich nach archive.org zu schieben.
Replicating a media-hyped color by numbers Etsy map in 10 minutes
Thats beautiful… how long it took?
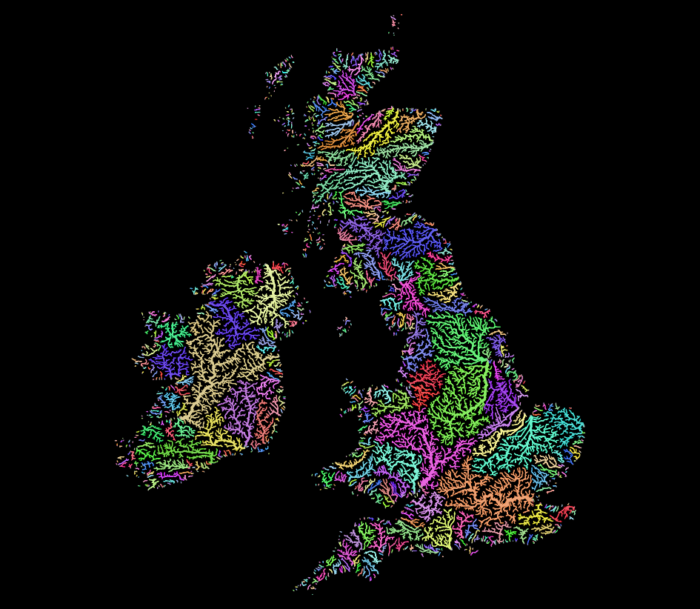
Well, that looks like QGIS’ random colors applied to http://hydrosheds.org/
So I fired up QGIS, extracted the region from eu_riv_15s.zip, realised those rivers came without a corresponding basin, extracted the region from eu_bas_15s_beta.zip, set the map background to black, set the rivers to render in white, set the rivers’ line width to correspond to their UP_CELLS attribute (best with an exponential scale via Size Assistant), put the basins on top, colored them randomly by BASIN_ID, set the layer rendering mode to Darken or Multiply and that was it.

I should open an Etsy store.
Yes, I realise that replicating things is easier than creating them. But seriously, this is just a map of features colored by category and all the credit should go to http://hydrosheds.org/
Update
But Hannes, that original has some gradients!
Ok, then set the rivers not to white but a grey and the basin layer rendering mode to Overlay instead of Darken.

This product incorporates data from the HydroSHEDS database which is © World Wildlife Fund, Inc. (2006-2013) and has been used herein under license. WWF has not evaluated the data as altered and incorporated within, and therefore gives no warranty regarding its accuracy, completeness, currency or suitability for any particular purpose. Portions of the HydroSHEDS database incorporate data which are the intellectual property rights of © USGS (2006-2008), NASA (2000-2005), ESRI (1992-1998), CIAT (2004-2006), UNEP-WCMC (1993), WWF (2004), Commonwealth of Australia (2007), and Her Royal Majesty and the British Crown and are used under license. The HydroSHEDS database and more information are available at http://www.hydrosheds.org.
Update: Someone asked me for more details so I made a video. Because I did not filter the data to a smaller region I did not use a categorical style in this example (300,000 categories QGIS no likey) but simply a random assignment.
Data-defined images in QGIS Atlas
Say you want to display a feature specific image on each page of a QGIS Atlas.
In my example I have a layer with two features:
{
  "type": "FeatureCollection",
  "features": [
    {
      "type": "Feature",
      "properties": {
        "image_path": "/tmp/1.jpeg"
      },
      "geometry": {
        "type": "Polygon",
        "coordinates": [[[9,53],[11,53],[11,54],[9,54],[9,53]]]
      }
    },
    {
      "type": "Feature",
      "properties": {
        "image_path": "/tmp/2.jpeg"
      },
      "geometry": {
        "type": "Polygon",
        "coordinates": [[[13,52],[14,52],[14,53],[13,53],[13,52]]]
      }
    }
  ]
}
And I also have two JPEG images, named “1.jpeg” and “2.jpeg” are in my /tmp/ directory, just as the “image_path” attribute values suggest.
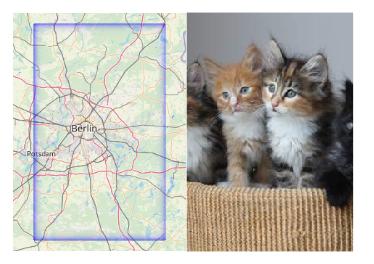
The goal is to have a map for each feature and its image displayed on the same page.
Create a new print layout, enable Atlas, add a map (controlled by Atlas, using the layer) and also an image.
For the “image source” enable the data-defined override and use attribute(@atlas_feature, 'image_path') as expression.
That’s it, now QGIS will try to load the image referenced in the feature’s “image_path” value as source for the image on the Atlas page. Yay kittens!
Building QGIS with debugging symbols
As I keep searching the web for way too long again and again, I hope this post will be #1 next I forget how to build QGIS with debugging symbols.
Add CMAKE_BUILD_TYPE=Debug to the cmake invocation.
E.g.:
cmake -G "Unix Makefiles" ../ \
    -DCMAKE_BUILD_TYPE=Debug
    ...
For a not as safe but more performant compilation, you can use RelWithDebInfo. I just found out today but will use that in the future rather than the full-blown Debug. See https://cmake.org/pipermail/cmake/2001-October/002479.html for some background.
On Archlinux, also add options=(debug !strip) in your PKGBUILD to have them not stripped away later.
Writing one WKT file per feature in QGIS
Someone in #qgis just asked about this so here is a minimal pyqgis (for QGIS 3) example how you can write a separate WKT file for each feature of the currently selected layer. Careful with too many features, filesystems do not like ten thousands of files in the same directory. I am writing them to /tmp/ with $fid.wkt as filename, adjust the path to your liking.
layer = iface.activeLayer()
features = layer.getFeatures()

for feature in features:
  geometry = feature.geometry()
  wkt = geometry.asWkt()

  fid = feature.attribute("fid")
  filename = "/tmp/{n}.wkt".format(n=fid)

  with open(filename, "w") as output:
    output.write(wkt)
Specifying the read/open driver/format with GDAL/OGR
For the commandline utilities you can’t. One possible workaround is using https://trac.osgeo.org/gdal/wiki/ConfigOptions#GDAL_SKIP and https://trac.osgeo.org/gdal/wiki/ConfigOptions#OGR_SKIP to blacklist drivers until the one you want is its first choice. A feature request exists at https://trac.osgeo.org/gdal/ticket/5917 but it seems that the option is not exposed as commandline option (yet?).
PS: If what you are trying to do is reading a .txt (or whatever) file as .csv and you get angry at the CSV driver only being selected if the file has a .csv extension, use CSV:yourfilename.txt
PPS: This post was motivated by not finding above information when searching the web. Hopefully this will rank high enough for *me* to find it next time. ;)

