How to get a dataset out of OpenStreetMap (OSM) and into QGIS easily

For small datasets just use the QuickOSM plugin, enter your key=value and it will load the data directly as QGIS layer(s).

For big datasets don’t run massive queries on the Overpass API but use prepared thematic or regional OpenStreetMap extracts.

For example, if you want all things tagged place=town globally, grab place_EPSG4326.zip from http://download.osmdata.xyz/ and run a filter on that locally.

Don’t be scared of processing a global OSM planet file either, Osmium makes filtering OSM data extremely easy:

osmium tags-filter in.osm.pbf n/place=town -o place=town.osm.pbf

Yes, a planet file is pretty big, but extracting specific features from that is not a big data problem and you must not be scared of it. Downloading the file will probably take you magnitudes longer than extracting something from it. For me it was 45 minutes for the download, then about 8 minutes for extracting on a seriously slow (~60MB/s) spinning metal hard disk drive (no SSD).

And yes, you can load OSM PBF directly into QGIS thanks to GDAL’s support for the format.

While we are at it: Don’t use GeoJSON for anything but data transfer and maybe storage. It is not an efficient format to power your layers and GIS analyses. (OSM PDF isn’t either.)

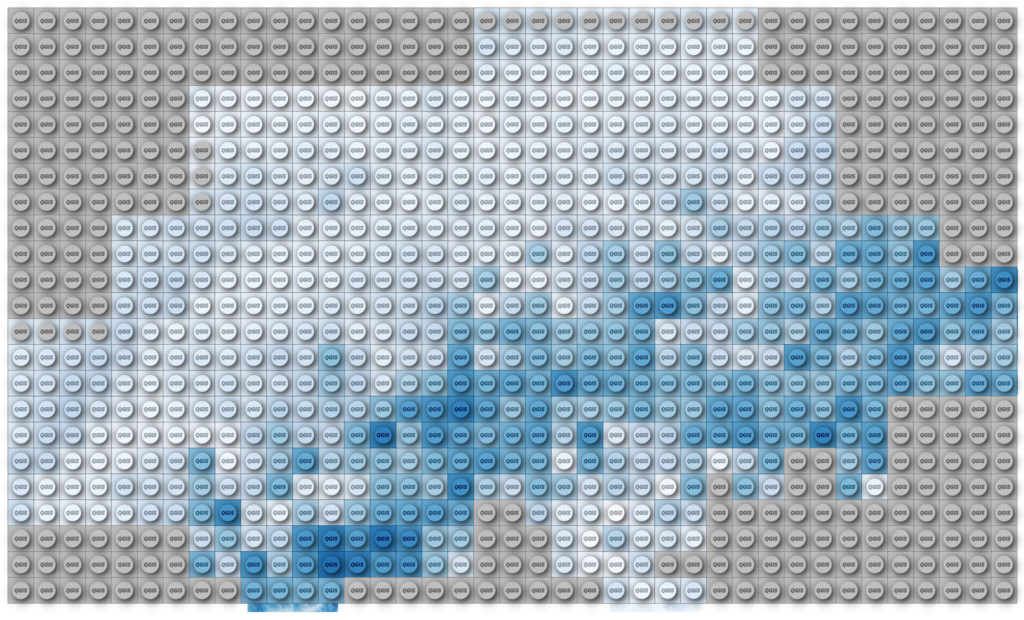
#30DayMapChallenge: Day 3 – Polygons OR Lego® style brick raster in QGIS using Geometry Generator expressions

I showed this at the annual meeting of the swiss user group in June 2019 and promptly forgot to post it for everyone to see. Let’s blame the scenery?

Have a raster.

Processing -> Create Grid, covering it with points in a spacing of your choice. Use the same CRS as your raster (unless you want to figure out expression-based geometry transformations on your own, like in my elevation lines code)

Change the Symbol layer type to Geometry Generator and enter

with_variable(
  'radius',
  3333,
  buffer($geometry, @radius, 16)
)

where radius should be a value about one third of your spacing.

You should see circles!

For the fill color use this expression and adjust the name of your raster layer:

with_variable(
    'raster_layer',
    'DHM200.xyz',
    ramp_color('Blues',  -- change to an other named ramp here if you like
        scale_linear(
            raster_value(
                @raster_layer, 1, 
                centroid($geometry)  -- back to our point
            ),
            raster_statistic(
                @raster_layer, 1, 
                'min'
            ),
            raster_statistic(
                @raster_layer, 1, 
                'max'
            ),
            0, 1  -- new scale as color ramps go 0 to 1
        )
    )
)

This will get the raster value below our grid point and fit it onto a color ramp between the min and max of all the raster values.

For the stroke use the same expression but wrap darker(..., 150) around it so you get a darker color.

Using Draw Effects add a small Drop Shadow to your circles. I used an offset of 0.5 mm and a blur radius of 1 mm.

Now add another Geometry Generator symbol layer below your existing one and use the following expression:

bounds(buffer($geometry, 5000))

with_variable(
  'radius',
  5000,
  bounds(
    buffer($geometry, @radius)
  )
)

with the radius being half your grid spacing.

Use the same expressions for the colors as above but set the darker value to 200.

For some more fanciness maybe add a “QGIS” text on top of the nupsies?

Exercise: Make it so that the result perfectly covers the raster, instead of being one grid cell off like mine.

Thanks Topi.

#30DayMapChallenge: Day 2 – Lines

Thanks Topi.

Addresses in Hamburg: http://suche.transparenz.hamburg.de/dataset/alkis-adressen-hamburg15

Convert the housenumber from string to integer: to_int("hausnr")

Processing -> Points to Path using above housenumber as order field and strname as group field.

Color those ziggyzaggety lines as you like.

Maybe explode the lines and style each segment by its housenumber?

And put them on an interactive slippy map.

Dynamic elevation profile lines as QGIS geometry generator

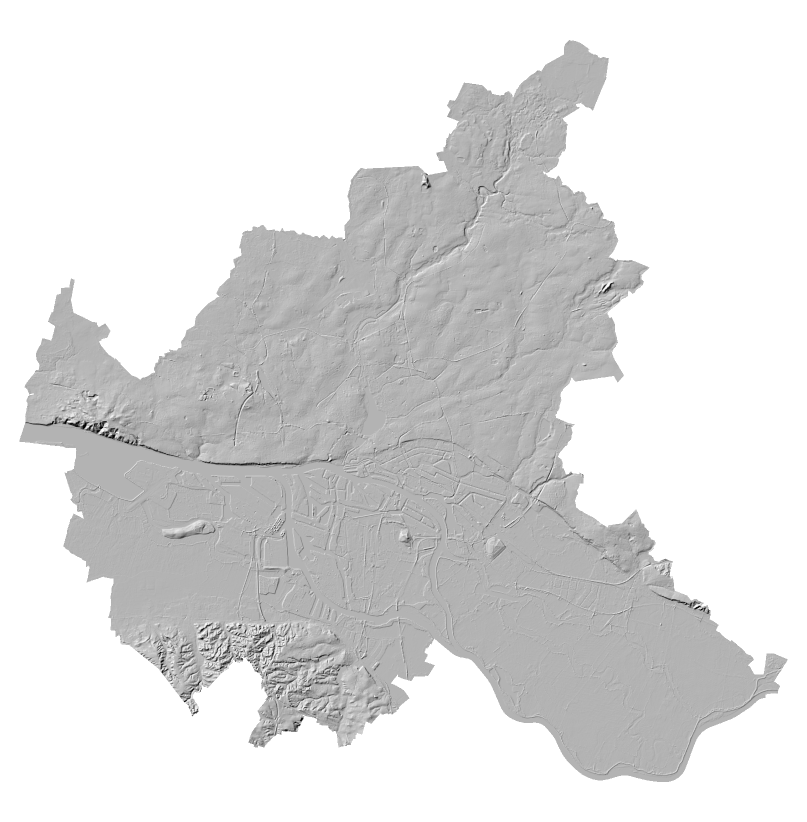
Load a raster layer in QGIS.

Add a new Scratch Layer of Polygon type (in any CRS). Set its Symbology to Inverted Polygons. Use a Geometry Generator as symbol layer type. Set it to LineString/MultiLineString. Enter the expression below and adjust the layer ID (best enter the expression editor and find it in the “layers” tree). Then adjust the scaling factor at the very bottom.

-- UPPER CASE comments below are where you can change things

with_variable(
	'raster_layer',
	'long_and_complicated_layer_id',  -- RASTER LAYER to sample from
	-- this collects all the linestrings generated below into one multilinestring
	collect_geometries(
		-- a loop for each y value of the grid
		array_foreach(
			-- array_foreach loops over all elements of the series generated below
			-- which is a range of numbers from the bottom to the top of y values
			-- of the map canvas extent coordinates.
			-- the result will be an array of linestrings
			generate_series(
				y(@map_extent_center)-(@map_extent_height/2), -- bottom y
				y(@map_extent_center)+(@map_extent_height/2),  -- top y
				@map_extent_height/50  -- stepsize -> HOW MANY LINES
			),
			
			-- we want to enter another loop so we assign the name 'y' to
			-- the current element of the array_foreach loop
			with_variable(
				'y',
				@element,
				
				-- now we are ready to generate the line for this y value
				make_line(
					-- another loop, this time for the x values. same logic as before
					-- the result will be an array of points
					array_foreach(
						generate_series(
							x(@map_extent_center)-(@map_extent_width/2), -- left x
							x(@map_extent_center)+(@map_extent_width/2),  -- right x
							@map_extent_width/50  -- stepsize -> HOW MANY POINTS PER LINE
						),
						-- and here we create each point of the line
						make_point(
							@element,  -- the current value from the loop over the x value range
							@y  -- the y value from the outer loop
							+   -- will get an additional offset to generate the effect
							-- we look for values at _this point_ in the raster, and since
							-- the raster might not have any value here, we must use coalesce
							-- to use a replacement value in those cases
							coalesce(  -- coalesce to catch raster null values
								raster_value(
									@raster_layer,
									1,  -- band 1, *snore*
									-- to look up the raster value we need to look in the right position
									-- so we make a sampling point in the same CRS as the raster layer
									transform( 
										make_point(@element, @y),
										@map_crs,
										layer_property(@raster_layer,'crs')
									)
								),
								0  -- coalesce 0 if raster_value gave null
							-- here is where we set the scaling factor for the raster -> y values
							-- if things are weird, set it to 0 and try small multiplications or divisions
							-- to see what happens.
							-- for metric systems you will want to multiply
							-- for geographic coordinates you will want to divide
							)*10  -- user-defined factor for VERTICAL EXAGGERATION
						)
					)
				)
			)
		)
	)
)  -- wee

If you don’t have your raster data on a SSD this can be a bit slow.

Yes, this works if you change your CRS!

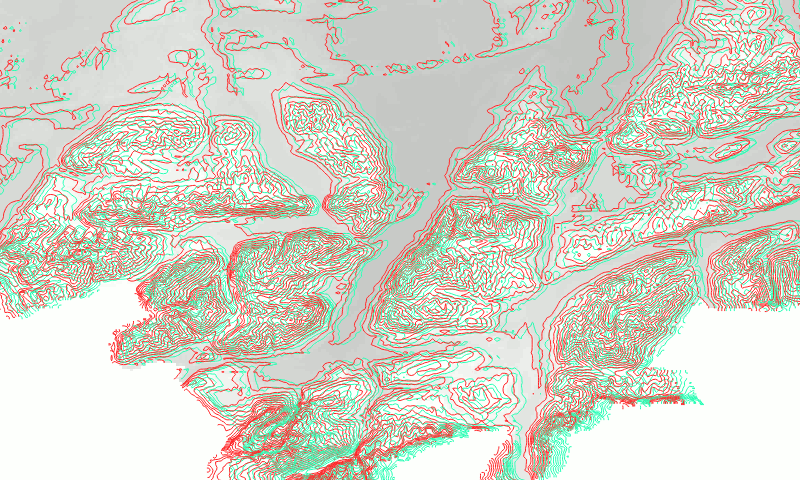
Anaglyph 3D contour lines

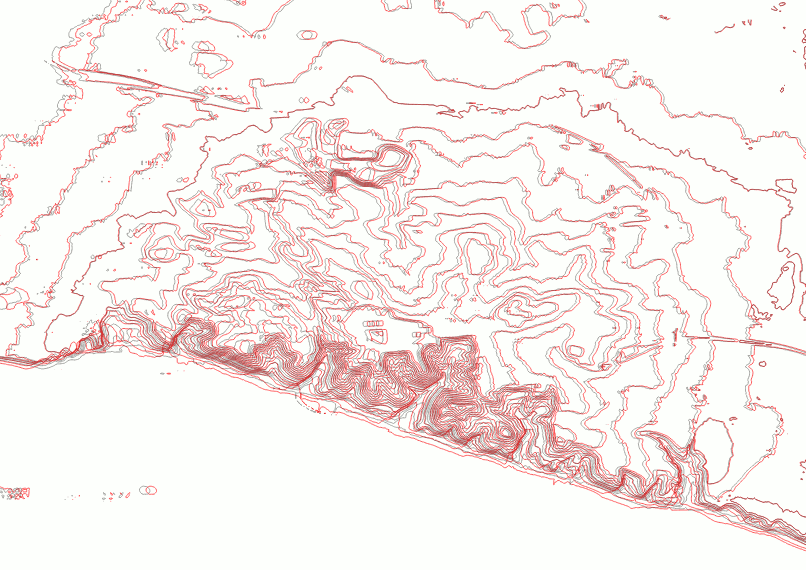
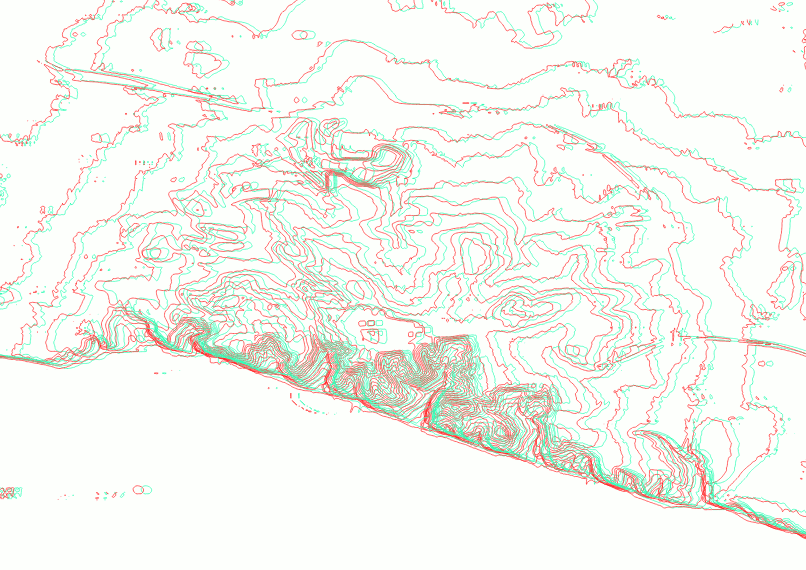
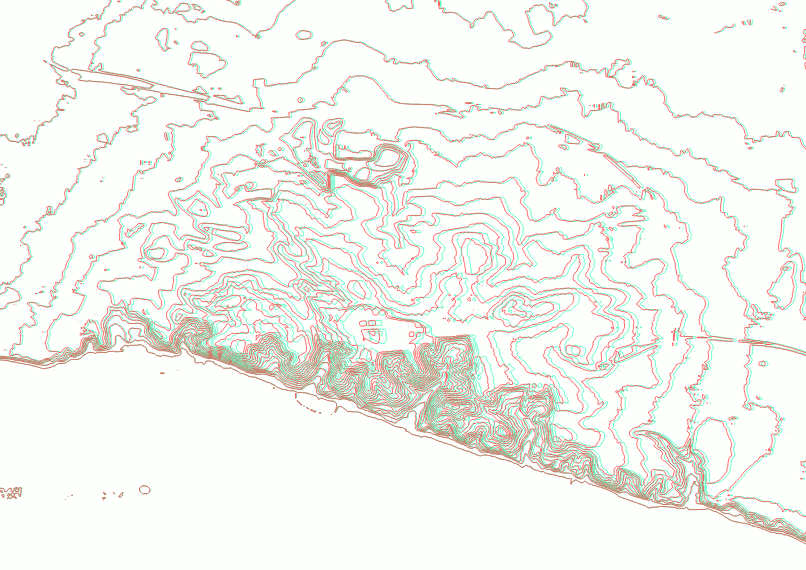
A slight misunderstanding about a weird pattern I posted to Twitter earlier made me wonder how easy it might be to present elevation data with real depth ™ as anaglyph 3D in QGIS. Anaglyph 3D, you know, those red and cyan glasses that rarely ever worked.

You might remember my post on fake chromatic aberration and dynamic label shadows in QGIS some months ago. Maybe with some small adjustments of the technique…?

Wikipedia has an detailed article on the topic if you are interested. It boils down to: One eye gets to see not the red but the cyan stuff. The other sees the red but not the cyan. By copying, coloring and shifting elements left-right increasingly the human vision gets tricked into seeing fake depth.

Got your anaglyph glasses? Oogled some images you found online to get in the mood? Excellent, let’s go!

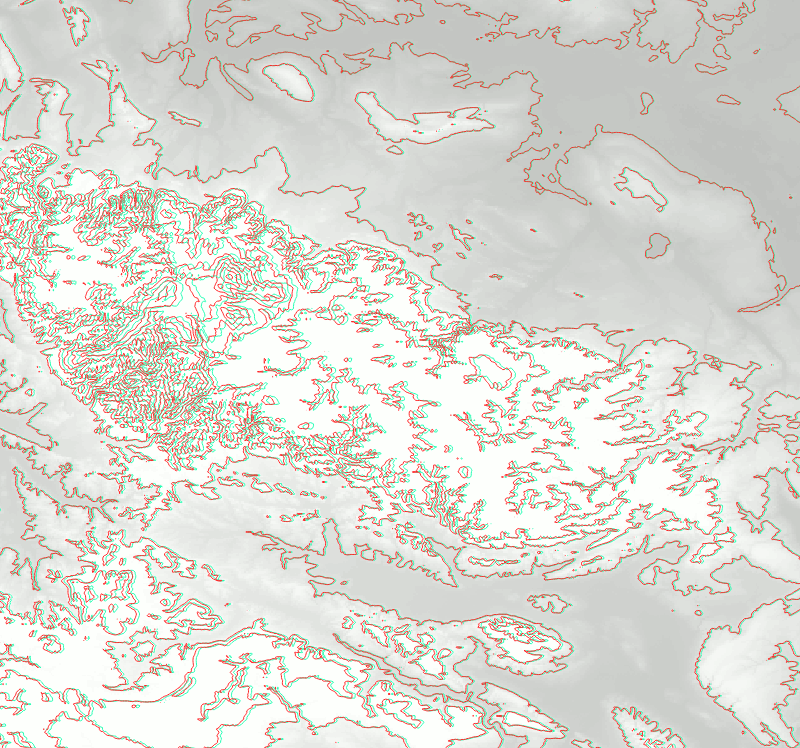
Get some DEM data. I used a 10 meter DEM of Hamburg and a 200 meter DEM of Germany for testing. Make sure both your data and your project/canvas CRS match or you have a hard time with the math.

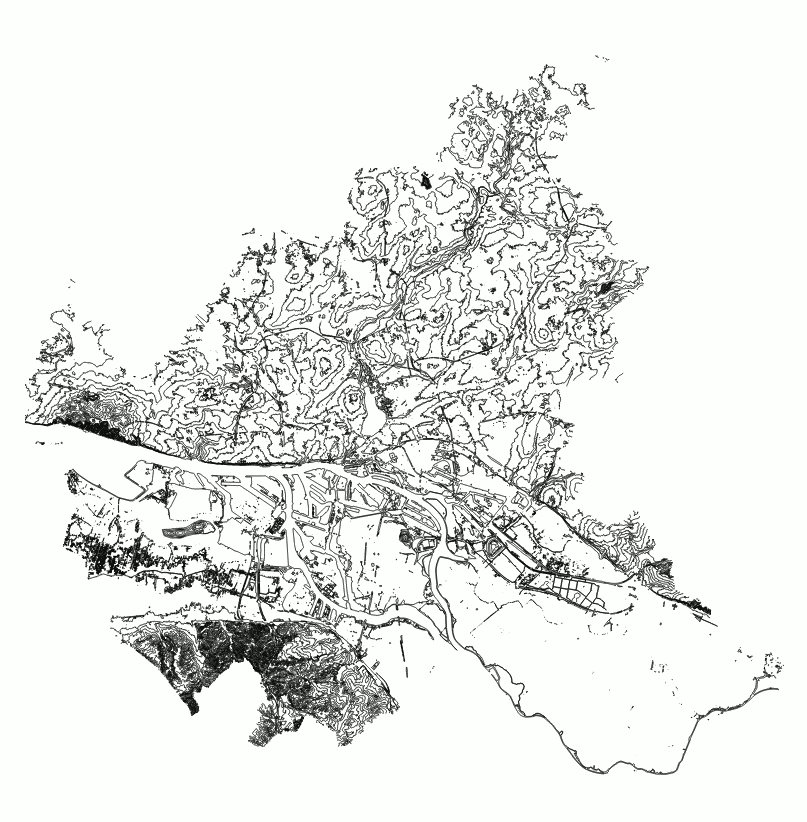
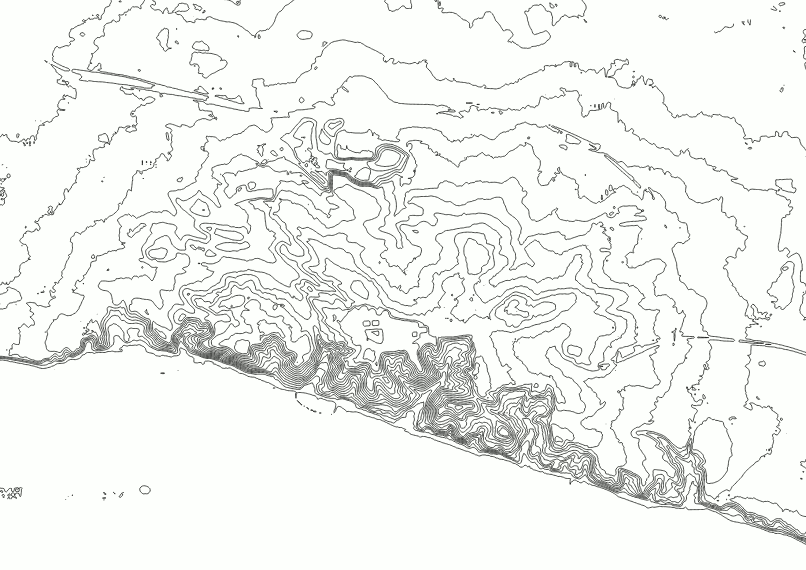
Extract contours at a reasonable interval. What’s reasonable depends on your data. I used an interval of 5 meters for the 10 meter DEM as Hamburg is rather flat (which you will NOT see here).

You may want to simplify or smooth this.

Now it’s time to zoom in, because the effect only works if the line density is appropriately light.

Now we need to duplicate those, color them and move them left and right.

Change the symbol layer of your contours to a Geometry Generator.

Let’s use that first layer for the left, red part. So change the color to red. Use a red that vanishes when you look through your left (red) eye but is clearly visible through the right (cyan) eye. The exact color depends on your glasses.

Set the Geometry Generator to LineString. I will now explain an intermediate step so if you just want the result, scroll a bit.

translate(
  $geometry,
  -  -- there is a minus here!
  (
    x_max(@map_extent) - x(centroid($geometry))
  )
  /100  -- magic scale value…
  ,
  0  -- no translation in y
)

This moves each contour line to the left for a value that increases with the geometry’s distance to the right side. Since we don’t want to move the geometries too far, a magic scale factor needs to be added and adjusted according to your coordinate values.

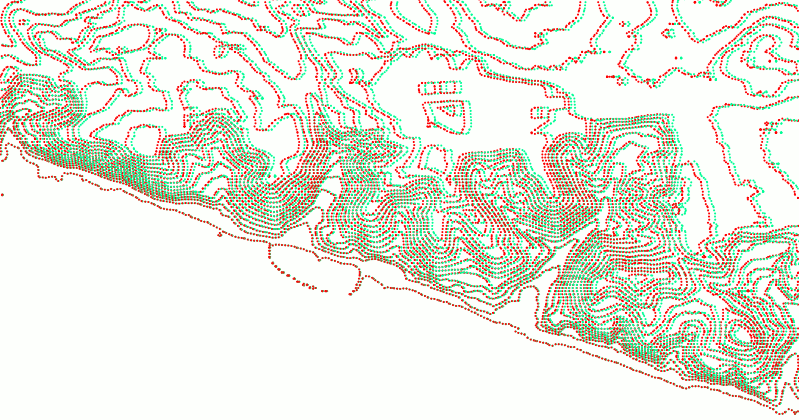
(Yes, that is a bug right here (centroid is a bad metric and some of the contours are huge geometries) but hey it works well enough. Segmentizing could fix this. Or just extract the vertices, that looks cool too TODO imagelink)

For the right, cyan side we need to add another Geometry Generator symbol layer, color it in cyan (so that you can only see it through your left eye) and do the geometry expression the other way around:

translate(
  $geometry,
  (
    x(centroid($geometry))-x_min(@map_extent)
  )
  /100  -- magic scale value…
  ,
  0  -- no translation in y
)

Cool! But this is lacking a certain depth, don’t you think? We need to scale the amount of horizontal shift by the elevation value of the contour lines. And then we also need to adjust the magic scale value again because reasons.

For the red symbol layer:

translate(
  $geometry,
  -- move to the LEFT
  -- scaled by the distance to the RIGHT side of the map
  -- scaled by the elevation

  -- minus so it goes to the left
  -
  "ELEV" -- the attribute field with the elevation values
  *
  (x_max(@map_extent)-x(centroid($geometry)))
  
  -- MAGIC scale value according to CRS and whatever
  /10000
  ,
  -- no change for y
  0
)

For the cyan symbol layer:

translate(
  $geometry,
  -- move to the RIGHT
  -- scaled by the distance to the LEFT side of the map
  -- scaled by the elevation
 
  "ELEV" -- the attribute field with the elevation values
  *
  (x(centroid($geometry))-x_min(@map_extent))
  
  -- MAGIC scale value according to CRS and whatever
  /10000
  ,
  -- no change for y
  0
)

That’s it!

Now, who is going to do Autostereograms? Also check out http://elasticterrain.xyz.

Make sure you actually do use spatial indexes


Ever ran some GIS analysis in QGIS and it took longer than a second? Chances are that your data did not have spatial indexes for QGIS to utilise and that it could have been magnitudes faster.

I realised just today, after years of using QGIS, that it did not automatically create a spatial index when saving a Shapefile. And because of that, lots of GIS stuff I did in the past, involving saving subsets of data to quick’n’dirty Shapefiles, was slower than necessary.

Sadly QGIS does not communicate lack of spatial indexing to the user in any way. I added a feature request to make Processing warn if no indexing is available.

An example: Running ‘Count points in polygon’ on 104 polygons with 223210 points:

  • Points in original GML file: 449 seconds
    • GML is not a format for processing but meant for data transfer, never ever think of using it for anything else
  • Points in ESRI Shapefile: 30 seconds
  • Points in GeoPackage: 3 seconds
  • Points in ESRI Shapefile with spatial index: 3 seconds
    • Same Shapefile as before but this time I had created a .qix index

So yeah, make sure you don’t only use a reasonable format for your data. And also make sure you do actually have an spatial index.

For Shapefiles, look for a .qix or .sbn side-car file somewhere in the heap of files. In QGIS you can create a spatial index for a vector layer either using the “Create spatial index” algorithm in Processing or the button of the same title in the layer properties’ source tab.

PS: GeoPackages always have a spatial index. That’s reason #143 why they are awesome.

Calculating the metric distance between latitudes with PostGIS

Postgres’ WITH clauses and window functions are so awesome.

-- generate values from -90 to 90, increment by 1
WITH values AS (
  SELECT generate_series AS latitude
  FROM generate_series(-90, 90)
),
-- create a geographic point each
points AS (
  SELECT ST_MakePoint(0, latitude)::geography AS point FROM values
)
SELECT
  -- latitude values of subsequent points
  format(
    '%s° to %s°',
    ST_Y(point::geometry),
    ST_Y(lag(point::geometry) OVER ())
  ) AS latitudes,
  -- geographic distance between subsequent points, formatted to kilometers
  format(
    '%s km',
    to_char(ST_Distance(point, lag(point) OVER ())/1000, '999D99')
  ) AS distance
FROM points
OFFSET 1  -- skip the first row, no lag there
;

    latitudes  |  distance  
 --------------+------------
  -89° to -90° |  111.69 km
  -88° to -89° |  111.69 km
  -87° to -88° |  111.69 km
  -86° to -87° |  111.69 km
  -85° to -86° |  111.69 km
  -84° to -85° |  111.68 km
  -83° to -84° |  111.68 km
  -82° to -83° |  111.67 km
  -81° to -82° |  111.67 km
  -80° to -81° |  111.66 km
  -79° to -80° |  111.66 km
  -78° to -79° |  111.65 km
  -77° to -78° |  111.64 km
  -76° to -77° |  111.63 km
  -75° to -76° |  111.62 km
  -74° to -75° |  111.61 km
  -73° to -74° |  111.60 km
  -72° to -73° |  111.59 km
  -71° to -72° |  111.58 km
  -70° to -71° |  111.57 km
  -69° to -70° |  111.56 km
  -68° to -69° |  111.54 km
  -67° to -68° |  111.53 km
  -66° to -67° |  111.51 km
  -65° to -66° |  111.50 km
  -64° to -65° |  111.49 km
  -63° to -64° |  111.47 km
  -62° to -63° |  111.45 km
  -61° to -62° |  111.44 km
  -60° to -61° |  111.42 km
  -59° to -60° |  111.40 km
  -58° to -59° |  111.39 km
  -57° to -58° |  111.37 km
  -56° to -57° |  111.35 km
  -55° to -56° |  111.33 km
  -54° to -55° |  111.31 km
  -53° to -54° |  111.30 km
  -52° to -53° |  111.28 km
  -51° to -52° |  111.26 km
  -50° to -51° |  111.24 km
  -49° to -50° |  111.22 km
  -48° to -49° |  111.20 km
  -47° to -48° |  111.18 km
  -46° to -47° |  111.16 km
  -45° to -46° |  111.14 km
  -44° to -45° |  111.12 km
  -43° to -44° |  111.10 km
  -42° to -43° |  111.08 km
  -41° to -42° |  111.06 km
  -40° to -41° |  111.04 km
  -39° to -40° |  111.03 km
  -38° to -39° |  111.01 km
  -37° to -38° |  110.99 km
  -36° to -37° |  110.97 km
  -35° to -36° |  110.95 km
  -34° to -35° |  110.93 km
  -33° to -34° |  110.91 km
  -32° to -33° |  110.90 km
  -31° to -32° |  110.88 km
  -30° to -31° |  110.86 km
  -29° to -30° |  110.84 km
  -28° to -29° |  110.83 km
  -27° to -28° |  110.81 km
  -26° to -27° |  110.80 km
  -25° to -26° |  110.78 km
  -24° to -25° |  110.77 km
  -23° to -24° |  110.75 km
  -22° to -23° |  110.74 km
  -21° to -22° |  110.72 km
  -20° to -21° |  110.71 km
  -19° to -20° |  110.70 km
  -18° to -19° |  110.69 km
  -17° to -18° |  110.67 km
  -16° to -17° |  110.66 km
  -15° to -16° |  110.65 km
  -14° to -15° |  110.64 km
  -13° to -14° |  110.63 km
  -12° to -13° |  110.63 km
  -11° to -12° |  110.62 km
  -10° to -11° |  110.61 km
  -9° to -10°  |  110.60 km
  -8° to -9°   |  110.60 km
  -7° to -8°   |  110.59 km
  -6° to -7°   |  110.59 km
  -5° to -6°   |  110.58 km
  -4° to -5°   |  110.58 km
  -3° to -4°   |  110.58 km
  -2° to -3°   |  110.58 km
  -1° to -2°   |  110.58 km
  0° to -1°    |  110.57 km
  1° to 0°     |  110.57 km
  2° to 1°     |  110.58 km
  3° to 2°     |  110.58 km
  4° to 3°     |  110.58 km
  5° to 4°     |  110.58 km
  6° to 5°     |  110.58 km
  7° to 6°     |  110.59 km
  8° to 7°     |  110.59 km
  9° to 8°     |  110.60 km
  10° to 9°    |  110.60 km
  11° to 10°   |  110.61 km
  12° to 11°   |  110.62 km
  13° to 12°   |  110.63 km
  14° to 13°   |  110.63 km
  15° to 14°   |  110.64 km
  16° to 15°   |  110.65 km
  17° to 16°   |  110.66 km
  18° to 17°   |  110.67 km
  19° to 18°   |  110.69 km
  20° to 19°   |  110.70 km
  21° to 20°   |  110.71 km
  22° to 21°   |  110.72 km
  23° to 22°   |  110.74 km
  24° to 23°   |  110.75 km
  25° to 24°   |  110.77 km
  26° to 25°   |  110.78 km
  27° to 26°   |  110.80 km
  28° to 27°   |  110.81 km
  29° to 28°   |  110.83 km
  30° to 29°   |  110.84 km
  31° to 30°   |  110.86 km
  32° to 31°   |  110.88 km
  33° to 32°   |  110.90 km
  34° to 33°   |  110.91 km
  35° to 34°   |  110.93 km
  36° to 35°   |  110.95 km
  37° to 36°   |  110.97 km
  38° to 37°   |  110.99 km
  39° to 38°   |  111.01 km
  40° to 39°   |  111.03 km
  41° to 40°   |  111.04 km
  42° to 41°   |  111.06 km
  43° to 42°   |  111.08 km
  44° to 43°   |  111.10 km
  45° to 44°   |  111.12 km
  46° to 45°   |  111.14 km
  47° to 46°   |  111.16 km
  48° to 47°   |  111.18 km
  49° to 48°   |  111.20 km
  50° to 49°   |  111.22 km
  51° to 50°   |  111.24 km
  52° to 51°   |  111.26 km
  53° to 52°   |  111.28 km
  54° to 53°   |  111.30 km
  55° to 54°   |  111.31 km
  56° to 55°   |  111.33 km
  57° to 56°   |  111.35 km
  58° to 57°   |  111.37 km
  59° to 58°   |  111.39 km
  60° to 59°   |  111.40 km
  61° to 60°   |  111.42 km
  62° to 61°   |  111.44 km
  63° to 62°   |  111.45 km
  64° to 63°   |  111.47 km
  65° to 64°   |  111.49 km
  66° to 65°   |  111.50 km
  67° to 66°   |  111.51 km
  68° to 67°   |  111.53 km
  69° to 68°   |  111.54 km
  70° to 69°   |  111.56 km
  71° to 70°   |  111.57 km
  72° to 71°   |  111.58 km
  73° to 72°   |  111.59 km
  74° to 73°   |  111.60 km
  75° to 74°   |  111.61 km
  76° to 75°   |  111.62 km
  77° to 76°   |  111.63 km
  78° to 77°   |  111.64 km
  79° to 78°   |  111.65 km
  80° to 79°   |  111.66 km
  81° to 80°   |  111.66 km
  82° to 81°   |  111.67 km
  83° to 82°   |  111.67 km
  84° to 83°   |  111.68 km
  85° to 84°   |  111.68 km
  86° to 85°   |  111.69 km
  87° to 86°   |  111.69 km
  88° to 87°   |  111.69 km
  89° to 88°   |  111.69 km
  90° to 89°   |  111.69 km


I tried to package a package+CLI+GUI for Python

And I gave up trying.

Here is our project: https://gitlab.com/g2lab/cogran-python

  • There is a python package in cogran/.
  • There are scripts in scripts/, one CLI interface, one QT GUI.
  • There are docs in docs/.

The GUI uses images and text from the docs for live help.
So we need to make sure that our docs directory is included when packaging this all for others to install.

I tried for two days to make sense of the jungle of Python packaging. StackOverflow is full of non-explanatory half-answers, there are about 7 APIs implemented by 35 different projects with 42 different documentations and 98 different versions. Either I massively failed to find the one, wonderful, canonical, documented approach or this really is neither explicit nor beautiful.

So I give up. Can you help me out?

Do we need to integrate the docs into the actual package? Should we instead have three separate things: The cogran module package, a cogran-cli package, a cogran-gui package?

The setup

For building I used

rm -r build/ dist/ cogran.egg-info/ ; \
python setup.py sdist && \
python setup.py bdist_wheel

For looking into the resulting archives I used

watch tar tvf dist/cogran-0.1.0.tar.gz

and

watch unzip -t dist/cogran-0.1.0-py3-none-any.whl

For installing I used

pip uninstall --yes cogran ; \
pip install --no-cache-dir --user --upgrade dist/cogran-0.1.0.tar.gz && \
find ~/.local/ | grep cogran

and

pip uninstall --yes cogran ; \
pip install --no-cache-dir --user --upgrade dist/cogran-0.1.0-py3-none-any.whl && \
find ~/.local/ | grep cogran

What happens

sdist includes all kinds of stuff like the .gitignore and the examples directory. Both should not be included at the moment. Installing the resulting cogran-0.1.0.tar.gz will just install the package (cogran/__init__.py) and the scripts. Nothing else.

bdist_wheel only includes the package and the scripts. Nothing else.

Adding a MANIFEST.in

After fucking around with many iterations of fruitless attempts of writing a MANIFEST.in file that beautifully builds upon the someone-said default includes I gave in and wrote a very explicit one: https://gitlab.com/snippets/1850708

global-exclude *

graft cogran
graft docs
graft scripts
graft tests

include README.md
include LICENSE

include setup.py
include requirements.txt

global-exclude __pycache__
global-exclude *.py[co]

Now sdist includes all the stuff I want and nothing I do not want. Excellent. Installing the tar.gz however again only installed the package and the scripts.

The wheel again only had the package and the scripts inside.

setup.py: include_package_data=True

You just need to add include_package_data=True to your setup.py, people said. So I did. And no, that would only work for things inside our package, not directories on the same level. So this would change nothing.

setup.py: data_files

Supply the paths to the files in a data_files list, someone said. So I added an explicit list (at this stage I just wanted it to work, who cares about manual effort, future breakage and ugliness):

data_files = [
  ("docs", (
    "docs/images/Areal Weighting.png",
    "docs/images/Attribute Weighting.png",
    "docs/images/postcodes vs districts.png",
    "docs/images/Binary Dasymetric Weighting.png",
    "docs/images/N-Class Dasymetric Weighting.png",
    "docs/help.html"
  ))
]

And yes, now these files end up in the wheel. But guess what, they still do not get installed anywhere

setup.py: package_data

https://github.com/pypa/sampleproject/blob/master/setup.py#L164 like include_package_data only applies to data inside the package, our’s is on the side.

What now?

User cannot log in to your MediaWiki?

I just spent too much time on this. A user could not log in to a wiki I maintain. We tried everything. At some point I must have fixed the main issue but sadly I had introduced a new one. Here is what happened in the hopes that if *you* read this, you can fix it as easily as me (spending much less time on it).

Looking at the browser’s network log we noticed that the wiki first logged them in but then, on the redirect to the main page, deleted the cookies again.

Looking at the debugging log of the wiki I saw:

[authentication] Primary login with MediaWiki\Auth\LocalPasswordPrimaryAuthenticationProvider succeeded
[authentication] Login for bob succeeded

...

[DBQuery] wiki BEGIN /* Wikimedia\Rdbms\Database::query (User::saveSettings) 31.16.28.131 */

[DBQuery] wiki
UPDATE /* User::saveSettings 31.16.28.131 */ user
SET user_name = 'bob',user_real_name = '',
user_email = 'bob@example.com',
user_email_authenticated = NULL,
user_touched = '20190423202751',
user_token = 'stripped',
user_email_token = NULL,
user_email_token_expires = NULL
WHERE user_id = '3' AND user_touched = '20190423202746'

[DBQuery] wiki ROLLBACK /* MWExceptionHandler::rollbackMasterChangesAndLog 31.16.28.131 */

[exception] [stripped] /w/index.php?title=Special:UserLogin&returnto=Main+Page
MWException from line 4026 of /srv/wiki/w/includes/user/User.php: CAS update failed
on user_touched for user ID '3' (read from replica); the version of the user to be
saved is older than the current version.
#0 /srv/wiki/w/includes/session/SessionBackend.php(648): User->saveSettings()
#1 /srv/wiki/w/includes/deferred/MWCallableUpdate.php(30): MediaWiki\Session\SessionBackend->MediaWiki\Session\{closure}()
#2 /srv/wiki/w/includes/deferred/DeferredUpdates.php(257): MWCallableUpdate->doUpdate()
#3 /srv/wiki/w/includes/deferred/DeferredUpdates.php(210): DeferredUpdates::runUpdate(MWCallableUpdate, Wikimedia\Rdbms\LBFactorySimple, string, integer)
#4 /srv/wiki/w/includes/deferred/DeferredUpdates.php(131): DeferredUpdates::execute(array, string, integer)
#5 /srv/wiki/w/includes/MediaWiki.php(905): DeferredUpdates::doUpdates(string)
#6 /srv/wiki/w/includes/MediaWiki.php(731): MediaWiki->restInPeace(string)
#7 /srv/wiki/w/includes/MediaWiki.php(750): MediaWiki->{closure}()
#8 /srv/wiki/w/includes/MediaWiki.php(554): MediaWiki->doPostOutputShutdown(string)
#9 /srv/wiki/w/index.php(43): MediaWiki->run()
#10 {main}

So after the login succeeded there was an exception which invalidated the session and caused the wiki to delete the cookie on the next page load. The stupid reason for this was that someone (not me, ha ha ha) earlier set the user’s user_touched field to 0 because surely that was a safe value. Setting it to 20190423202746 instead let the user log in just fine. And afterwards it was happily updated by the wiki again.