Flowers in QGIS?

The other day I was working on visualisation of some intermediate research stuff and ended up with something looking like a bouquet of flowers.

Twitter liked it so here is a how-to.

  1. Have some lines that meet in a shared point. They should have a shared ID per group (in my case they were MultiLineStrings).
  2. Color them per ID.
  3. Turn the background black.
  4. Use an Arrow style for the lines. Set the Head thickness to half the Arrow width. Set the Head length to whatever you consider fancy.
  5. Remove the Outline (set No Pen).
  6. Set the Feature blending mode to Multiply (or to Screen or Dodge or Addition if you prefer fireworks to flowers).
  7. Set an appropriate color scheme. For flowers I think RdYlGn works great (that’s how I realised what my random tinkering had lead to) or PiYg or simply Spectral, for fireworks random colors.

That’s it! Now play around and have some fun!

Initial setup failed. Cannot continue. Error: Couldn’t run mojosetup

If you are trying to install a game downloaded from gog.com but you get something like

$ ./gog_shadow_tactics_blades_of_the_shogun_2.2.0.3.sh
Verifying archive integrity… All good.
Uncompressing Shadow Tactics: Blades of the Shogun (GOG.com) 100%
Collecting info for this system…
Operating system: linux
CPU Arch: x86_64
trying mojosetup in bin/linux/x86_64
USING en_US

PANIC
Initial setup failed. Cannot continue.

Error: Couldn’t run mojosetup

then your file is corrupted or incomplete. You will have to re-download it. Ignore the “bin/linux/x86_64” path, that references something inside the installer, not something on your system.

Petition GOG to add checksums to their download pages or better yet, have reasonable download options that support resuming and HTTPS and what not…

FOSSGIS 2017

Die FOSSGIS 2017 in Passau war grandios. Ich bin sooo froh, dass ich mich auf den weiten Weg gemacht hatte. Die Liste von Vortragsaufzeichnungen, die ich selbst noch anschauen will, ist lang… Ausprobieren muss ich unbedingt (mal wieder) ein aktuelles GRASS GIS, GVSIG CE (das Poster hat Lust gemacht), osmium, die ganzen Vector Tiles Tools uvm.

Selbst gewagt habe ich einen Lightning Talk über Interaktive Visualisierung von Geodaten in Jupyter Notebooks (Youtube) sowie einen Vortrag zu meinem Projekt GeoPackages der freien Hamburger Geodaten (Youtube) anzufertigen.

Der LT kam so extrem gut an, dass ich nächstes Mal wohl um einen richtigen Vortrag oder auch Workshop kaum herum komme. :o)

Für den Geopackage-Vortrag hatte ich leider die Daten und Skripte zuhause gelassen und musste daher etwas improvisieren… Trotzdem war kam auch er gut an und ich habe großartigen Input bekommen, z.B. dass es ein tolles neues QGIS-Plugin für GML Application Schema Gedöns gibt und einen GMLAS-Treiber in GDAL. Danke!

Bei spontanen QGIS-Anwender- und Vereinstreff habe ich nachgefragt, wie es eigentlich mit QGIS an den Hochschulen aussieht und wie ich meinen Arbeitgeber vielleicht mal auf den Weg von Esri/IDRISI zu QGIS bringen kann. Da war ausser Claas Leiners Lehre in Kassel wenig bekannt. Vielleicht starte ich mal eine kleine Recherche, um etwas Einblick in die Landschaft zu bekommen. Wäre doch klasse, wenn sich mehr Unis von proprietärer Software entsagen mögen!

What does it look like if you move all countries onto the same location?

Note from 2019-12-07: This is neither efficient nor up-to-date with modern PROJ. Better don’t copy and paste but just take non-projection/-transformation parts if you need them…

Sunday pre-lunch Python fun: What does it look like if you move all countries onto the same location?

1
2
3
4
5
6
7
8
9
10
11
12
13
14
15
16
17
18
19
20
21
22
23
24
25
26
27
28
29
30
31
32
33
34
35
36
37
38
39
40
41
42
43
44
45
46
47
48
49
50
51
52
53
54
55
56
57
import fiona
from shapely.geometry import *
from fiona.crs import from_string
from fiona.transform import transform_geom
from shapely.affinity import translate
 
def get_biggest_polygon(multipolygon):
    assert isinstance(geometry, MultiPolygon)
 
    max_area = 0
    biggest_polygon = None
    for polygon in geometry:
        if polygon.area > max_area:
            max_area = polygon.area
            biggest_polygon = polygon
    return biggest_polygon
 
def project_locally(geometry, from_crs):
    """centered on the centroid of the geometry"""
    # ugly because i map/shape back and forth, maybe try shapely instead
    lat = geometry.centroid.y
    lon = geometry.centroid.x
 
    to_crs = from_string("+proj=aeqd  +R=6371000 +lat_0={lat} +lon_0={lon}".format(lat=lat, lon=lon))
    reprojected_geometry = transform_geom(
        from_crs, 
        to_crs, 
        mapping(geometry)
    )
 
    return shape(reprojected_geometry)
 
with fiona.open("ne_10m_admin_0_countries.shp") as countries:
    centered_polygons = []
 
    for country in countries:
        geometry = shape(country['geometry'])
 
        # only use the biggest part of each country, otherwise everything sucks
        if isinstance(geometry, MultiPolygon):
            polygon = get_biggest_polygon(geometry)
        else:
            polygon = geometry
 
        # project nicely
        polygon = project_locally(polygon, countries.crs)
 
        # centering on 0,0 is simply moving the geometry by MINUS its x/y
        dx = -polygon.centroid.x
        dy = -polygon.centroid.y
        translated_polygon = translate(polygon, dx, dy)
 
        centered_polygons.append(translated_polygon)
 
with open("/tmp/outfile.wkt", "w") as sink:
    for polygon in centered_polygons:
        sink.write(polygon.wkt+"\n")

Use this in any way you like but please share your creations and code as well. :)

Some rough explanation: For each country I check if it is a multipolygon and if so, use only its biggest “sub”-polygon in the next steps. I then project the WGS84 coordinates to an Azimuthal Equidistant projection centered on the centroid of the polygon. That new geometry gets shifted to sit on the origin of the system. I collect all those polygons and write them as plain WKT to a file. Styling was done in QGIS.

And for the smart folk, the same but without local projection:

One SRTMGL1 GeoTIFF to rule them all

NOTE: In up to date GDAL things might be easier AND I messed up with --config and -co below. Poke me to update it please.

So about half a year ago Lukas Martinelli asked about a global SRTM GeoTIFF. The SRTM elevation data is usually shared in many small tiles which can be ideal for some cases but annoying for others. I like downloading and processing big files so I took that as a challenge. It’s probably some mental thing. I never finished this blog post back then. It’s probably another mental thing. 8) Read on if you are interested in some GNU coreutils hackery as well as GDAL magick.

Here is how I did it. Endless thanks as usual to Even Rouault who fixed GDAL bugs and gave great hints. I learned more about GeoTIFFs and GDAL than I should have needed to know.

Downloading the source files

The source files are available at http://e4ftl01.cr.usgs.gov/SRTM/SRTMGL1.003/2000.02.11/ (warning, visiting this URL will make your browser cry and potentially render your system unresponsive). To download them you must create an NASA Earthdata Login at https://urs.earthdata.nasa.gov/users/new/. :\

********************************************************************************

                         U.S. GOVERNMENT COMPUTER

This US Government computer is for authorized users only.  By accessing this
system you are consenting to complete monitoring with no expectation of privacy.
Unauthorized access or use may subject you to disciplinary action and criminal
prosecution.

OMGOMGOMG. I am sure they would have used <blink> if accessibility guidelines allowed it. As I am not sure what their Terms of Service are, I will not give you a copy’n’paste ready line to download them all. wget or aria2 work well. You should get 14297 files with a total size of 98G.

Inspecting the ZIP files and preparing for GDAL’s vsizip

Each of those ZIP files has just a single file “.hgt” inside. GDAL specifically has support for the “SRTM HGT Format“, so we know it can read those files. We just need to extract them. (If you clicked that link you see that with GDAL 2.2 it will support directly loading the data from the ZIPs, that’s just Even being awesome.)

We don’t want to uncompress all those files just because we want to build a GeoTIFF from them later, do we? Luckily GDAL has a vsizip thingie which allows it to read files inside zip archives. Wicked! For this we need the “deep” paths to the files though, for example e4ftl01.cr.usgs.gov/SRTM/SRTMGL1.003/2000.02.11/N29E000.SRTMGL1.hgt.zip/N29E000.hgt.

The files inside the archives are always simply the same filename minus the “.SRTMGL1” and the .zip extension. Perfect, now we know all the files from inside the ZIPs! Right? Nope. Unfortunately some (17) of the archives do include the “.SRTMGL1” bit in their files, for example N38E051.SRTMGL1.hgt… >:(

That’s why we need to look into each zip file and determine the filename inside. (Alternatively *you* could extract them all after all, you with your fancy, huge SSD.)

We can simply use `unzip` with the `-t` switch to make it show what’s inside (and as a “free” benefit it will also check the file’s integrity for us). `tee` is used here to save the output to a file. This will take a while as it needs to read through all the files…

$ unzip -t "e4ftl01.cr.usgs.gov/SRTM/SRTMGL1.003/2000.02.11/*.SRTMGL1.hgt.zip" | tee unzip-t.log

...

Archive: e4ftl01.cr.usgs.gov/SRTM/SRTMGL1.003/2000.02.11/N29E000.SRTMGL1.hgt.zip
testing: N29E000.hgt OK
No errors detected in compressed data of e4ftl01.cr.usgs.gov/SRTM/SRTMGL1.003/2000.02.11/N29E000.SRTMGL1.hgt.zip.

Archive: e4ftl01.cr.usgs.gov/SRTM/SRTMGL1.003/2000.02.11/N27E033.SRTMGL1.hgt.zip
testing: N27E033.hgt OK
No errors detected in compressed data of e4ftl01.cr.usgs.gov/SRTM/SRTMGL1.003/2000.02.11/N27E033.SRTMGL1.hgt.zip.

Archive: e4ftl01.cr.usgs.gov/SRTM/SRTMGL1.003/2000.02.11/N45E066.SRTMGL1.hgt.zip
testing: N45E066.hgt OK
No errors detected in compressed data of e4ftl01.cr.usgs.gov/SRTM/SRTMGL1.003/2000.02.11/N45E066.SRTMGL1.hgt.zip.

14297 archives were successfully processed.

Yay, no errors!

In the output we see the path to the archive and we see the name of the file inside. With some sed and grep we can easily construct “deep” paths.

First we remove the status lines, the blank lines and the very last full status line with `grep`:

$ cat unzip-t.log | grep -v -e "No errors" -e '^$' -e 'successfully processed'

Archive: e4ftl01.cr.usgs.gov/SRTM/SRTMGL1.003/2000.02.11/N12E044.SRTMGL1.hgt.zip
testing: N12E044.hgt OK
Archive: e4ftl01.cr.usgs.gov/SRTM/SRTMGL1.003/2000.02.11/N29W002.SRTMGL1.hgt.zip
testing: N29W002.hgt OK
Archive: e4ftl01.cr.usgs.gov/SRTM/SRTMGL1.003/2000.02.11/N45E116.SRTMGL1.hgt.zip
testing: N45E116.hgt OK

Then we concatenate every consecutive two lines into one line with `paste` (I LOVE THIS 1 TRICK!):

$ cat unzip-t.log | grep -v -e "No errors" -e '^$' -e 'successfully processed' | paste - -

Archive: e4ftl01.cr.usgs.gov/SRTM/SRTMGL1.003/2000.02.11/N12E044.SRTMGL1.hgt.zip testing: N12E044.hgt OK
Archive: e4ftl01.cr.usgs.gov/SRTM/SRTMGL1.003/2000.02.11/N29W002.SRTMGL1.hgt.zip testing: N29W002.hgt OK
Archive: e4ftl01.cr.usgs.gov/SRTM/SRTMGL1.003/2000.02.11/N45E116.SRTMGL1.hgt.zip testing: N45E116.hgt OK

Finally we strip things away with sed (I don’t care that you would do it differently, this is how I quickly did it with my flair of hammering) and direct the output into a new file called `zips`:

$ cat unzip-t.log | grep -v -e "No errors" -e '^$' -e 'successfully processed' | paste - - | sed -e 's#Archive:[ ]*##' -e 's#\t[ ]*testing: #/#' -e 's#[ ]*OK##' > zips

e4ftl01.cr.usgs.gov/SRTM/SRTMGL1.003/2000.02.11/N12E044.SRTMGL1.hgt.zip/N12E044.hgt
e4ftl01.cr.usgs.gov/SRTM/SRTMGL1.003/2000.02.11/N29W002.SRTMGL1.hgt.zip/N29W002.hgt
e4ftl01.cr.usgs.gov/SRTM/SRTMGL1.003/2000.02.11/N45E116.SRTMGL1.hgt.zip/N45E116.hgt

Yay, we have all the actual inside-zip paths now!

If you are curious, you can try gdalinfo with those now. You need to prepend /vsizip/ to the path to make it read inside zip files.

$ gdalinfo /vsizip/e4ftl01.cr.usgs.gov/SRTM/SRTMGL1.003/2000.02.11/N12E044.SRTMGL1.hgt.zip/N12E044.hgt

Driver: SRTMHGT/SRTMHGT File Format
Files: /vsizip/e4ftl01.cr.usgs.gov/SRTM/SRTMGL1.003/2000.02.11/N12E044.SRTMGL1.hgt.zip/N12E044.hgt
Size is 3601, 3601
Coordinate System is:
GEOGCS["WGS 84",
    DATUM["WGS_1984",
        SPHEROID["WGS 84",6378137,298.257223563,
            AUTHORITY["EPSG","7030"]],
        AUTHORITY["EPSG","6326"]],
    PRIMEM["Greenwich",0,
        AUTHORITY["EPSG","8901"]],
    UNIT["degree",0.0174532925199433,
        AUTHORITY["EPSG","9122"]],
    AUTHORITY["EPSG","4326"]]
Origin = (43.999861111111109,13.000138888888889)
Pixel Size = (0.000277777777778,-0.000277777777778)
Metadata:
  AREA_OR_POINT=Point
Corner Coordinates:
Upper Left  (  43.9998611,  13.0001389) ( 43d59'59.50"E, 13d 0' 0.50"N)
Lower Left  (  43.9998611,  11.9998611) ( 43d59'59.50"E, 11d59'59.50"N)
Upper Right (  45.0001389,  13.0001389) ( 45d 0' 0.50"E, 13d 0' 0.50"N)
Lower Right (  45.0001389,  11.9998611) ( 45d 0' 0.50"E, 11d59'59.50"N)
Center      (  44.5000000,  12.5000000) ( 44d30' 0.00"E, 12d30' 0.00"N)
Band 1 Block=3601x1 Type=Int16, ColorInterp=Undefined
  NoData Value=-32768
  Unit Type: m

Hooray! GDAL reads the hgt file from inside its zip!

We need to prepend all the paths with `/vsizip/` so let’s do that:

$ sed 's#^#/vsizip/##' zips > vsizips

/vsizip/e4ftl01.cr.usgs.gov/SRTM/SRTMGL1.003/2000.02.11/N12E044.SRTMGL1.hgt.zip/N12E044.hgt
/vsizip/e4ftl01.cr.usgs.gov/SRTM/SRTMGL1.003/2000.02.11/N29W002.SRTMGL1.hgt.zip/N29W002.hgt
/vsizip/e4ftl01.cr.usgs.gov/SRTM/SRTMGL1.003/2000.02.11/N45E116.SRTMGL1.hgt.zip/N45E116.hgt

Unfortunately those 17 misnamed files from earlier need special treatment… This is what my notes say, not sure what it was supposed to do. If you are recreating this all, please just ask me and I will look at it again. For now, let’s just pretend that this leads to a file called `hgtfiles` in which all the paths are perfect and all the files are perfect.


grep -v 'SRTMGL1.hgt$' vsizips > vsizipswithoutmisnamedfiles
mkdir misnamedfiles
cd misnamedfiles/
nano ../listofmisnamedfiles # insert the paths to those 17 zips here #TODO
while read filename; do unzip "../${filename}"; done < ../listofmisnamedfiles
rename 's/SRTMGL1.//' *.hgt
cd ..
find misnamedfiles/ -type f > listofmisnamedfileshgt
cat listofmisnamedfileshgt vsizipswithoutmisnamedfiles > hgtfiles

As I said above though, go with a recent GDAL and this is all much easier. Even even included a check for the different filenames inside, how can you not like that guy!

Building a Virtual Raster Table

Virtual Raster Tables (VRT) are some kind of files that pretend to be rasters. They are awesome. Here we use a VRT that simply turns all the small rasters we have into one big ass raster.

Ok, ready to create a Virtual Raster Table!

$ time gdalbuildvrt -input_file_list hgtfiles srtmgl1.003.vrt

0...10...20...30...40...50...60...70...80...90...100 - done.

real 0m22.679s
user 0m19.250s
sys 0m3.105s

Done.

You could go ahead and use this for your work/leisure now. But remember, it is tens of gigabytes of data so if you do not use it at a 1:1 scale things will not be fun and might fry your cat. You want overviews/pyramids.

Turning the VRT into a GeoTIFF (Optional)

Let’s make a HUGEGEOTIFF because that’s cool! You don’t have to, instead you could build overviews for the .vrt file.

We want it quick to read and small so I used DEFLATE, TILED and the horizontal predictor. I ran this on a weak i7 with 2G of RAM and can’t remember what the worst bottleneck was. Probably CPU.

$ time gdal_translate -co NUM_THREADS=ALL_CPUS --config PREDICTOR 2 -co COMPRESS=DEFLATE -co TILED=YES -co BIGTIFF=YES srtmgl1.003.vrt srtmgl1.003.vrt.tif

Input file size is 1296001, 417601
0...10...20...30...40...50...60...70...80...90...100 - done.

real 231m57.961s
user 503m23.044s
sys 3m14.600s

If you are courageous you can load that file in your GIS now. But again, unless you watch it at a 1:1 scale or something close to that it WILL not be much fun and potentially expose weaknesses in your GIS and fill up your system’s memory and crash and you had no unsaved work open, didn’t you?

Building Overviews

Overviews aka pyramids are usually about 1/3 the size of the full image. If they are not, you probably used different compression settings. This was the step that I expected to be just boring to wait for, but it turned out the most problematic. I tried all available free tools but none worked properly with an input this big. With GDAL we found a workaround after a while.

gdaladdo has problems building multiple overview levels with a file this big… The trick is to built the overviews sequentially, not in one invocation. The best solution at the moment was building overviews for overviews for overviews and so on until you reach a comfortable size. Something like:


gdaladdo -ro srtmgl1.003.tif 2
gdaladdo -ro srtmgl1.003.tif.ovr 2
gdaladdo -ro srtmgl1.003.tif.ovr.ovr 2
gdaladdo -ro srtmgl1.003.tif.ovr.ovr.ovr 2
gdaladdo -ro srtmgl1.003.tif.ovr.ovr.ovr.ovr 2 4 8 16 32 64 128 256 512

I used the following parameters:
gdaladdo -oo NUM_THREADS=ALL_CPUS --config GDAL_NUM_THREADS ALL_CPUS --config GDAL_CACHEMAX 2048 --config COMPRESS_OVERVIEW DEFLATE --config PREDICTOR_OVERVIEW 2 --config BIGTIFF_OVERVIEW YES -ro

ovrovrovrovrovrovrovrovrovrovr

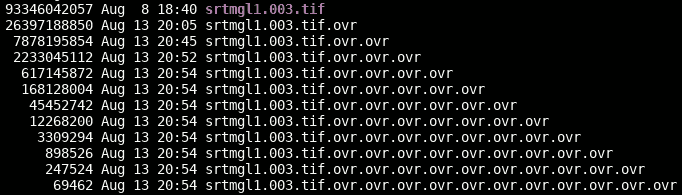
Apparently gdaladdo automatically makes them tiled, which is good. I used https://gist.github.com/springmeyer/3007985 to find out.

Creating overviews took just about 3 hours with this weird trick. So, in total the processing just takes half a day.

Download

Enjoy! https://www.datenatlas.de/geodata/public/srtmgl1/. I impose no license/copyright/whatever on this derivative work.

TODO

Hillshading? Slope? You do it!

Found a better, faster way? You blog it!

We could add the overviews to the main image with `gdal_translate srtmgl1.003.tif srtmgl1.003.withovr.tif -co COPY_SRC_OVERVIEWS=YES [other options]` says Even.

This Stain On Old Paper Looks Just Like Germany OMG!

Following Doing things to the whole map canvas in QGIS and adding some blending to the mix (he-he), I ended up with this map. Nothing you could not do with simple post-processing in a raster image editor or even QGIS’ map composer I guess.

stain

It was simply the result of playing around, there probably is a faster or more efficient way.

First give your geometries some fancy texture with Raster image fill (left). Then constrict its display to just some blurry borders by using a grey fill, Blur draw effect with maximum strength and the Dodge Layer blending mode (right).

papergermanyborder

You could probably skip the texture for the geometry but I did not manage to get a similarly nice effect with a Simple fill.

Use the trick from Doing things to the whole map canvas in QGIS to fill your canvas with a polygon and give that a nice texture as well. Use Multiply as Layer blending mode and get social media hype for that unbelievable stain can you believe it looks like that???

From the same session comes this beauty (mostly due to Tom Patterson’s shading of course ;) ):
antarctica

Doing things to the whole map canvas in QGIS

Due to a minor bug in QGIS you need a very recent testing build. 2.16.3 is not recent enough but 2.16.4 would be.

For cool tricks like vignetting or other eye candy, having a geometry that spans the whole map canvas in QGIS can be very useful.

Using the @map_* Variables available in expressions in combination with a Geometry generator style allows you to do this.

@map_extent_center returns a Point geometry of the current map canvas center, with x(@map_extent_center) and y(@map_extent_center) you get the x and y coordinates of it in the current CRS.
@map_extent_width and @map_extent_height return the width respectively height of the map canvas in CRS units.

Our goal is to create a polygon that exactly matches the map canvas extents. Some simple math gets you there.

First create Points for each of the corners by alternating the x+/-width and y+/-height. Then create a Line from all of them (the last point does not need to be the first again, make_polygon does that for you). And use the line as outer ring for a Polygon.

make_polygon(
 make_line(
  make_point(x(@map_extent_center)-@map_extent_width/2, y(@map_extent_center)-@map_extent_height/2),
  make_point(x(@map_extent_center)+@map_extent_width/2, y(@map_extent_center)-@map_extent_height/2),
  make_point(x(@map_extent_center)+@map_extent_width/2, y(@map_extent_center)+@map_extent_height/2),
  make_point(x(@map_extent_center)-@map_extent_width/2, y(@map_extent_center)+@map_extent_height/2)
 )
)

To actually see this, you need to use the style on a layer with at least one feature that is always visible where you want to focus your map canvas. Just make a polygon layer with one polygon that encloses the whole area. The layer must be in the same CRS as the project I think.

You now have a Polygon that corresponds with the map canvas. Give it a radial gradient fill with some transparency and party!

radialgradient
hh-bw
schiff-bw
stadion-bw
stadion-red

All aerial images in the examples are

Lizenz: Datenlizenz Deutschland Namensnennung 2.0
Namensnennung: Freie und Hansestadt Hamburg, Landesbetrieb Geoinformation und Vermessung
http://daten-hamburg.de/geographie_geologie_geobasisdaten/digitale_orthophotos/DOP20/DOP20_HH_fruehjahrsbefliegung_2015.zip

To make sure the feature you want to highlight is in the center, you could use another layer and @map_extent_center.

Yes, this totally is a hack but it’s fun!

Transparenzportal Hamburg API: Alle Datensätze eines bestimmten Hosts

Let’s take it to the next level: Wir wollen alle auf daten-hamburg.de gehosteten Datensätze, weil da die ganzen schicken Geodaten sind. Wir müssen also einen Query bauen, der uns alle Datensätze gibt, die “^http://daten-hamburg.de/” in der resources.url haben.

Mit http://wiki.apache.org/solr/CommonQueryParameters kann man komplexe Queries schreiben, sagt http://docs.ckan.org/en/latest/api/index.html#ckan.logic.action.get.package_search . Mit ein bisschen Scrollen stößt man gegebenenfalls auf resource_search und über Google nach “ckan resource_search” auf https://github.com/ckan/ckan/issues/1494, dessen Query man dann nimmt und sich damit nach http://suche.transparenz.hamburg.de/api/action/resource_search?query=url:http://daten-hamburg.de/ durchhangelt. Voll einfach! … Der Query dauert mehrere Sekunden und scheint ALLE Hits zurückzugeben, super!

Download läuft, so langsam wie daten-hamburg.de eben leider ist: https://www.datenatlas.de/geodata/public/sources/

Insgesamt sind es rund 104 Gigabyte, allerdings inklusive einiger Duplikate. Übrigens stecken auch SHA256-Hashes in den Daten, praktisch zum Überprüfen der Downloads.

Ugly-but-does-the-job URLs rausziehen:
$ cat suche.transparenz.hamburg.de/api/action/resource_search@query\=url%3Ahttp%3A%2F%2Fdaten-hamburg.de%2F | json_pp | grep '"url"' | grep -Eo 'http.*"' | sed 's#"$##' > urls

Transparenzportal Hamburg API: Bisschen Basics

Grundlegende Links:
http://transparenz.hamburg.de/hinweise-zur-api/

http://transparenz.hamburg.de/contentblob/4354384/f19d09732a6ea80ae9808de157b5ba4c/data/mdm-schema1-6.pdf

http://docs.ckan.org/en/latest/api/index.html

Die Links zu den Daten stecken in den Resources der Packages, z.B.:

import urllib.request
import json
 
url = "http://suche.transparenz.hamburg.de/api/3/action/package_show?id=larmminderungsplanung-fluglarm-hamburg2"
 
with urllib.request.urlopen(url) as req:
	response = req.read()
	response_dict = json.loads(response.decode('utf-8'))
	assert response_dict['success']
 
result = response_dict['result']
resources = result['resources']
 
for resource in resources:
	print(resource['url'])

gibt uns

http://geodienste.hamburg.de/HH_WMS_Fluglaermschutzzonen?REQUEST=GetCapabilities&SERVICE=WMS
http://geodienste.hamburg.de/HH_WFS_Fluglaermschutzzonen?REQUEST=GetCapabilities&SERVICE=WFS
http://daten-hamburg.de/umwelt_klima/laermminderungsplanung_fluglaerm/Kurvenpunkte_Laermschutzbereich_Flughafen_Hamburg_EDDH.xlsx
http://suche.transparenz.hamburg.de/localresources/HMDK/335B680C-CA3E-4FE9-BC05-641BA565E366/Kurvenpunkte_Laermschutzbereich_Flughafen_Hamburg_EDDH.zip
http://daten-hamburg.de/umwelt_klima/laermminderungsplanung_fluglaerm/Laermminderungsplanung_Fluglaerm_HH_2015-07-27.zip
http://metaver.de/trefferanzeige?docuuid=335B680C-CA3E-4FE9-BC05-641BA565E366

Das ist doch schon mal was.