I have a raster where each cell is categorized with a value of either 1, 2 or 3.
In #QGIS, how would I determine the percentage of cells in each category?
This piqued my curiosity so here you go!
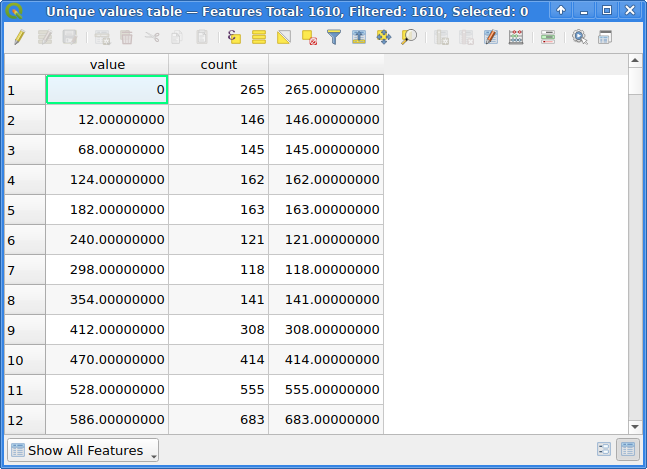
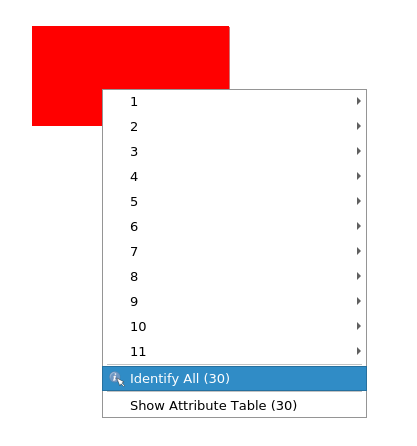
The Raster layer unique values report tool provides both a table containing value & count columns and a number of outputs, among other things TOTAL_PIXEL_COUNT and NODATA_PIXEL_COUNT.
Unique values tables for a UInt16 raster
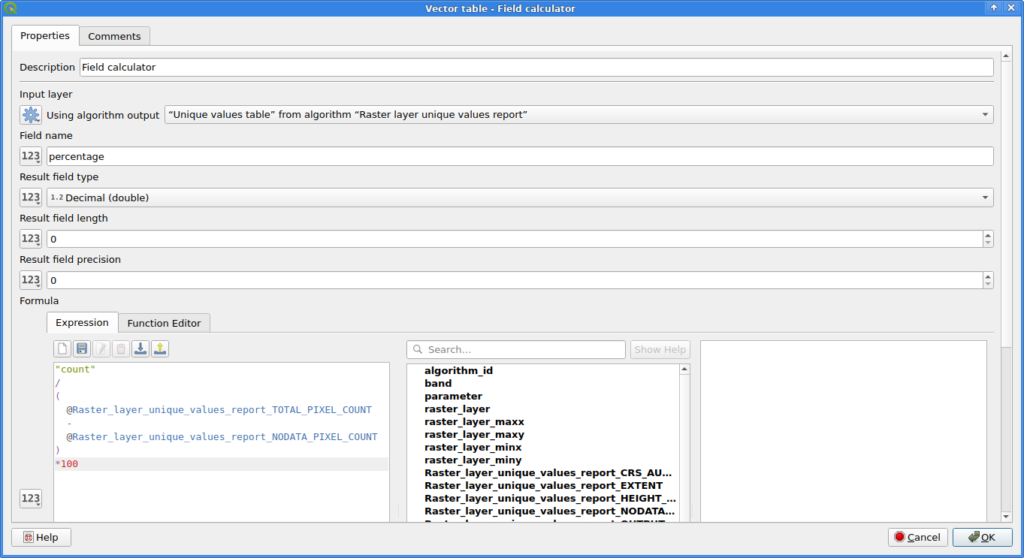
The Field calculator can be used to calculate an additional column for the table. Note that I decided for NODATA pixels to not count towards the total number of pixels here!
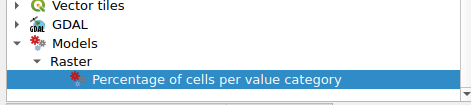
Combine them in a model, add appropriate inputs and you have a fancy new QGIS tool to calculate the percentages of each value in a raster image:
I just wanted to see if it was possible, it is not a sane thing to do.
PostgreSQL has a notification event system where you NOTIFY on a notification channel and clients can LISTEN for events.
QGIS already supports this for a convenient, remotely triggered refresh function of PostGIS layers by listening on the qgis channel if a PostgreSQL connection exists:
Load a PostGIS layer
Set its symbology to something dynamically randomized so you see changes if the map is refreshed
In the layer’s rendering options set it to refresh on notification
In a PostgreSQL client trigger a notification event, e.g. NOTIFY qgis, 'hi'; or SELECT pg_notify('qgis', 'refresh plz!');
The layer is refreshed in QGIS
You can set the layer(s) to refresh on any event on the qgis channel or only for specific messages. For example you could set each PostGIS layer to refresh on a different message, e.g. their table name and use that in a PostgreSQL trigger.
QGIS comes with PyQt and PyQt (of course) has its own API to let you talk to database servers. And luckily its QSqlDriver class even has a notification signal that let’s you react to notification events in the most convenient way.
So I wrote something:
from qgis.PyQt.QtSql import QSqlDatabase, QSqlQuery, QSqlDriver


def exec_notification(name, source, payload):
    """ZOMG don't ever do this!"""
    try:
        exec(payload.replace('\\n', '\n'))
    except SyntaxError as e:
        iface.messageBar().pushMessage("PG NOTIFY", str(e))

db = QSqlDatabase.addDatabase("QPSQL")
db.setConnectOptions("service=foo")  # using ~/.pg_service.conf
if not db.open():
    raise Exception(db.lastError().databaseText())
db.driver().subscribeToNotification("qgis_qtsql_channel")

db.driver().notification[
    str, QSqlDriver.NotificationSource, "QVariant"
].connect(exec_notification)
Run it in QGIS’ script editor and now you can remotely execute any Python code by sending it from PostgreSQL. For example:
Of course this is a horrible idea and you should never run code that a third-party sends to you. Instead you should write specific methods on the Python side and sent well defined messages to control exactly which methods get executed. But, hey it works!
Ideas
Trigger a notification if a PostgreSQL-stored QGIS project gets updated and in QGIS notify the user if they have said project open.
Make a tiny plugin that lets the user specify a mapping of message -> Python code scripts
TBC
Addendum
At first I had used a simple db.driver().notification.connect(on_notification), expecting the slot to simply receive all the arguments that the notification signal would send. But this led to Qt using a different notification signal (just sending the channel name) or something because the name is overloaded. Qt super explainer eyllanesc once again saved the day by showing that one can (and in this case needs to) specify the correct signature so Qt picks the correct signal to connect to. This was a major learning for me.
For debugging I used another slot function connected to the signal which uses both the QGIS message log and the message bar to inform the user about incoming notification events, take it if you want:
A bad surprise to me was that my QGIS installation on Ubuntu 22.04 (using https://qgis.org/ubuntu) did not have a dependency graph that included PostgreSQL support in QtSql. Ouch! I would have thought this would be usable in any standard QGIS installation out of the box. I had to install libqt5sql5-psql. On Windows this seems to be no issue, both a MSI installer and an advanced OSGeo4W install had the necessary modules. Phew!
The [PythonPlugins] section uses the plugins’ directory names and shows if a plugin is activated or not (true/false).
Plugins can store their options anywhere. No really. Anywhere! You will find some in their own sections, e. g.:
Qgis2threejs (directory “Qgis2threejs“) uses a [Qgis2threejs] section, named the same as its directory
First Aid (firstaid) uses a [FirstAid] section, using different case than its directory, and another section [firstaid] for other options
Plugin Builder 3 (pluginbuilder3) uses a [PluginBuilder] section, named differently than its directory
QGIS GML Application Schema Toolbox (gml_application_schema_toolbox) stores options in [QGIS%20GML%20Application%20Schema%20Toolbox] (needlessly) using URL encoding
Räumlicher Filter (spatial_filter) uses two sections: [SpatialFilter] and [SpatialFilterSymbol] (sorry, we didn’t know better…)
There is a [Plugins] and a [plugins] section. I found some plugins storing some options in the [plugins] section, e.g. First Aid storing some firstaid\debugger-geometry=... there. [Plugins] seems to be used by core plugins. [plugins] stores e.g. if QGIS should automatically check for new ones (although that is also might be tracked in the [plugin-manager] section, no idea which option comes from an older QGIS version maybe).
Some things can be stored elsewhere, I am not sure who does it, maybe some objects do this automatically? E.g. in the [QgsCollapsibleGroupBox] section you might find the states of all(?) QgsCollapsibleGroupBox objects such as gml_application_schema_toolbox\gmlas_bbox_group\collapsed=false concerning a plugin’s widget. Or in [Windows] you might find FirstAidDebugDialog\geometry=....
Plugins might alter any other options of course. There is no way of knowing what plugin touched what (great power and mostly good :) ).
Uninstalling a plugin does not remove the sections from the INI. The plugin itself does not have a chance to clean that up and QGIS has no way of knowing what to remove. (Of course it might be wanted to keep settings around, but it would be nice to be able to really prune something.)
tl;dr: There is no standard, no rules nor best practices for QGIS plugins to store their options.
PS: This post might get updated as I learn. Corrections and improvements are highly appreciated.
PPS: Excuse the big bold highlighting. That’s for me.
Then (if you really want to do it), uncomment the function call in the last line and execute the script. Follow the instructions.
To clean up remove or restore the QGIS/QGISCUSTOMIZATION3.ini file in your profile and remove the license directory from your profile, restore the previous value of UI/Customization/enabled in your profile (just remove the line or disable Settings -> Interface Customization).
If you want to hate yourself in the future, put it in a file called startup.py in QStandardPaths.standardLocations(QStandardPaths.AppDataLocation) aka the directory which contains the profiles directory itself.
BTW: If you end up with QGIS crashing and lines like these in the error output:
...
Warning: QPaintDevice: Cannot destroy paint device that is being painted
QGIS died on signal 11
...
It is probably not a Qt issue that caused the crash. The QPaintDevice warning might just be Qt telling you about your painter being an issue during clean up of the actual crash (which might just be a wrong name or indentation somewhere in your code, cough).
This was the final expression (with lots of opportunity to improve):
with_variable(
  'point_at_top_of_canvas',
  densify_by_count(
    make_line(
      point_n( @map_extent, 3),  -- no idea if these indexes are stable
      point_n( @map_extent, 4)
    ),
    42  -- number of trajectories
  ),
  collect_geometries(
    array_foreach(
      generate_series(1, num_points(@point_at_top_of_canvas)),
      with_variable(
        'point_n_of_top_line',
        point_n(@point_at_top_of_canvas, @element),
        point_n(
          wave_randomized(
            make_line(
              @point_n_of_top_line,
              -- make it at least touch the bottom of the canvas:
              translate(@point_n_of_top_line, 0, -@map_extent_height)
            ),
            -- fairly stupid frequency and wavelength but hey, works in any crs
            1, @map_extent_width/5,
            1, @map_extent_width/100,
            seed:=@element  -- stable waves \o/
          ),
          floor(epoch(now())%10000/50)  -- TODO make it loop around according to num_points of each line
        )
      )
    )
  )
)
Use it on an empty polygon layer with an inverted polygon style and set it to refresh at a high interval (0.01s?). Or use this QGIS project (I included some intermediate steps of the style as layer styles if you want to learn about this kind of stuff):
Not sure why I never posted this last year but I did the #30DayMapChallenge in a single day, streamed live via a self-hosted Owncast instance. It was … insane and fun. This year I will do it again, on the 26th of November.
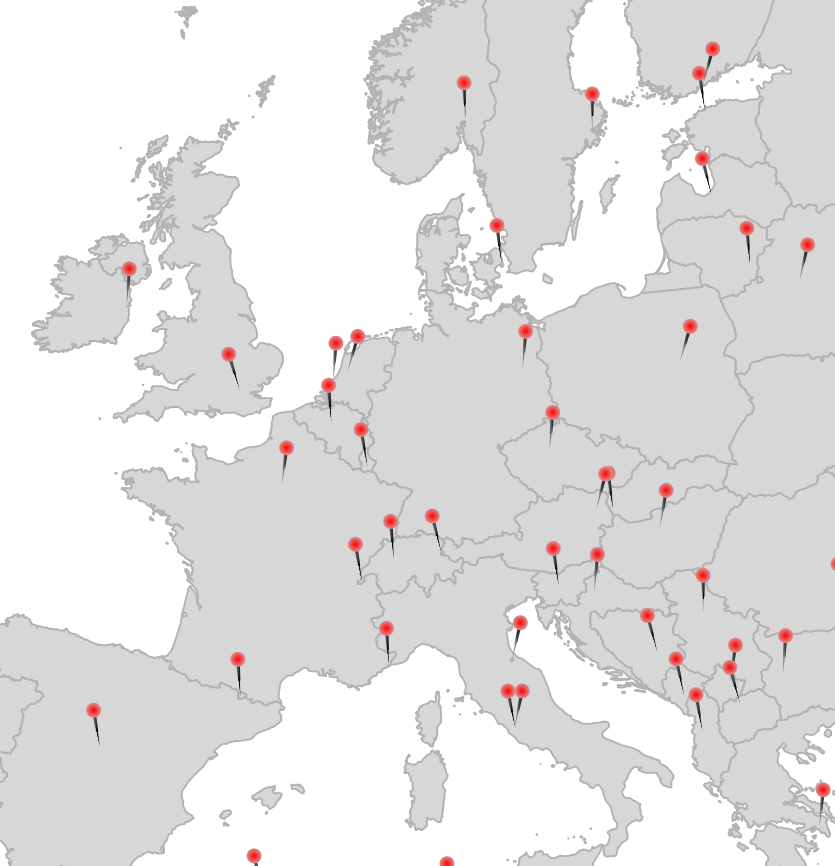
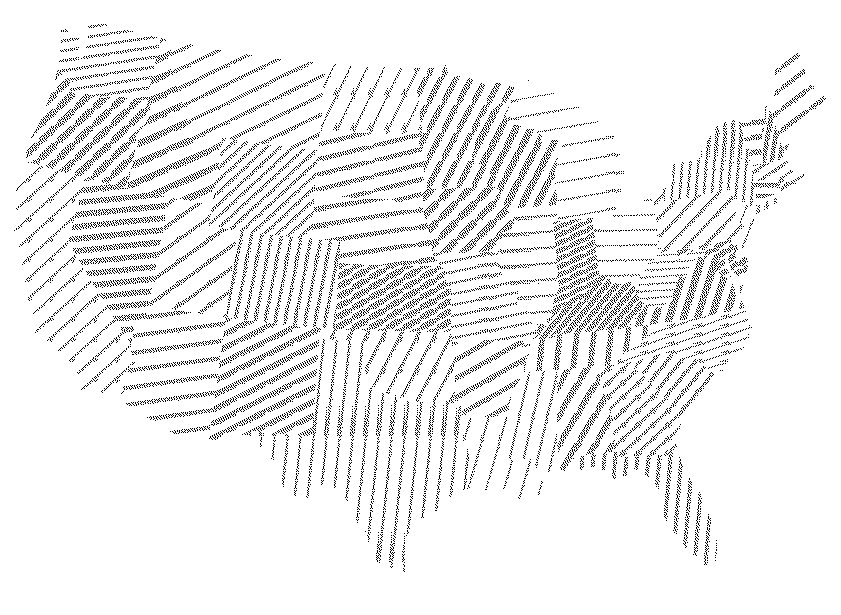
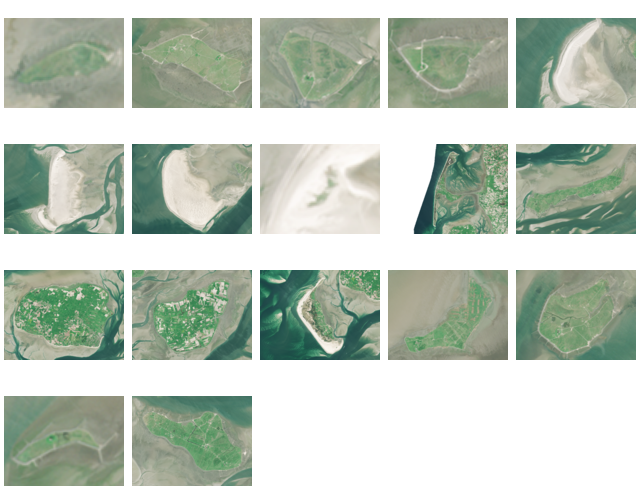
Here are most of the maps I made last year:
Some notes I kept, please bug me about recovering the others from my Twitter archive (I deleted old tweets a bit too early):
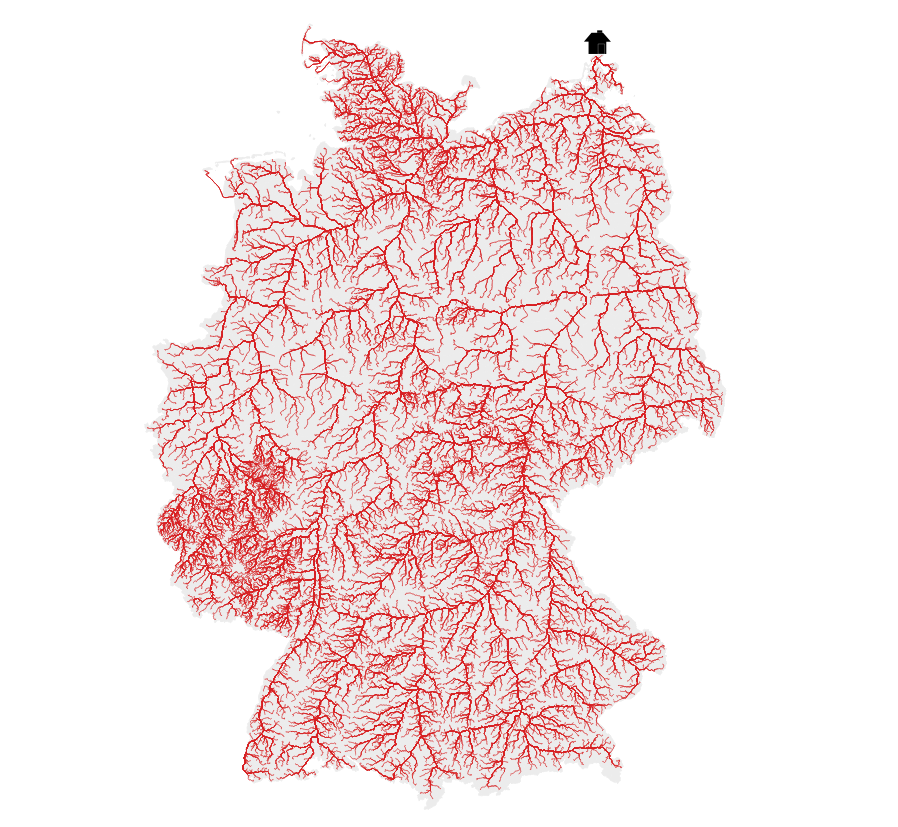
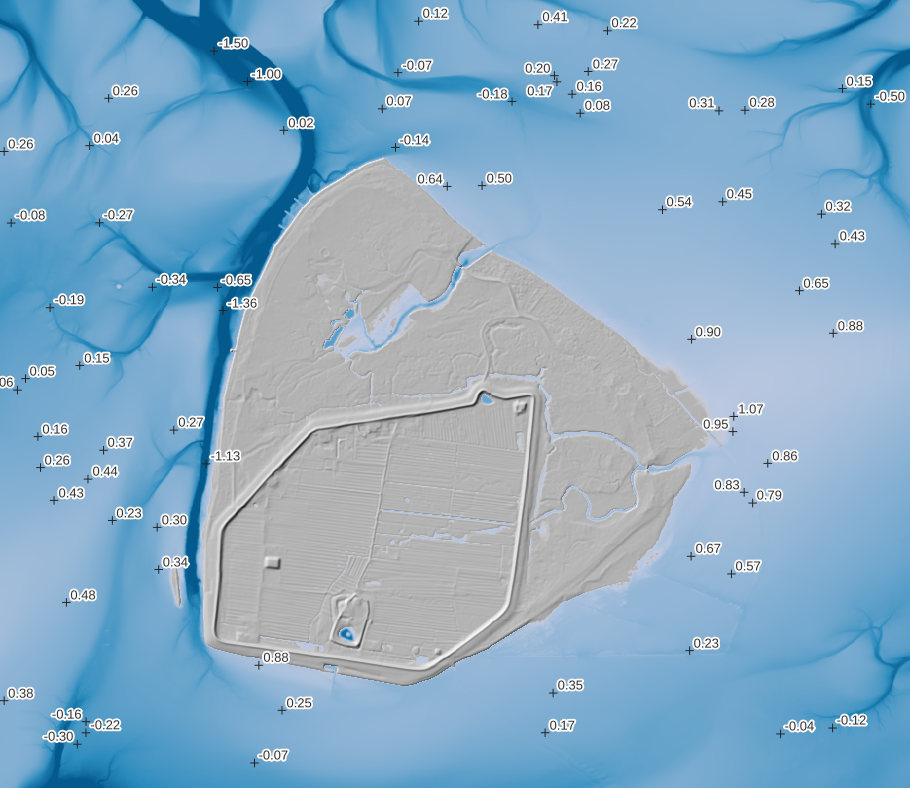
18 Water (DGM-W 2010 Unter- und Außenelbe, Wasserstraßen- und Schifffahrtsverwaltung des Bundes, http://kuestendaten.de, 2010)
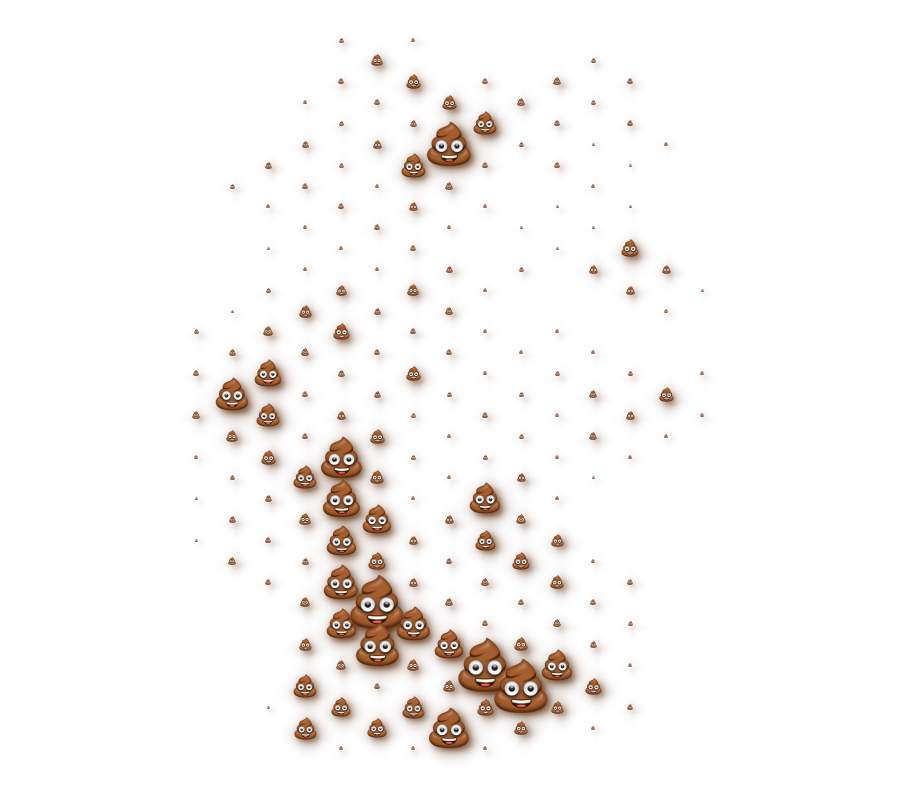
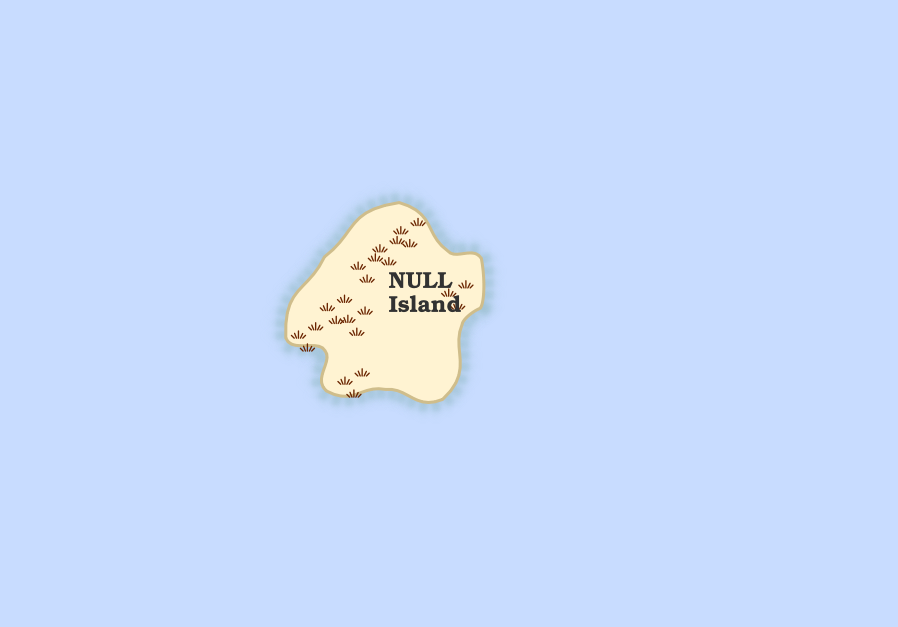
20 Movement: Emojitions on a curvy trajectory. State changes depending on the curvyness ahead. Background: (C) OpenStreetMap Contributors <3
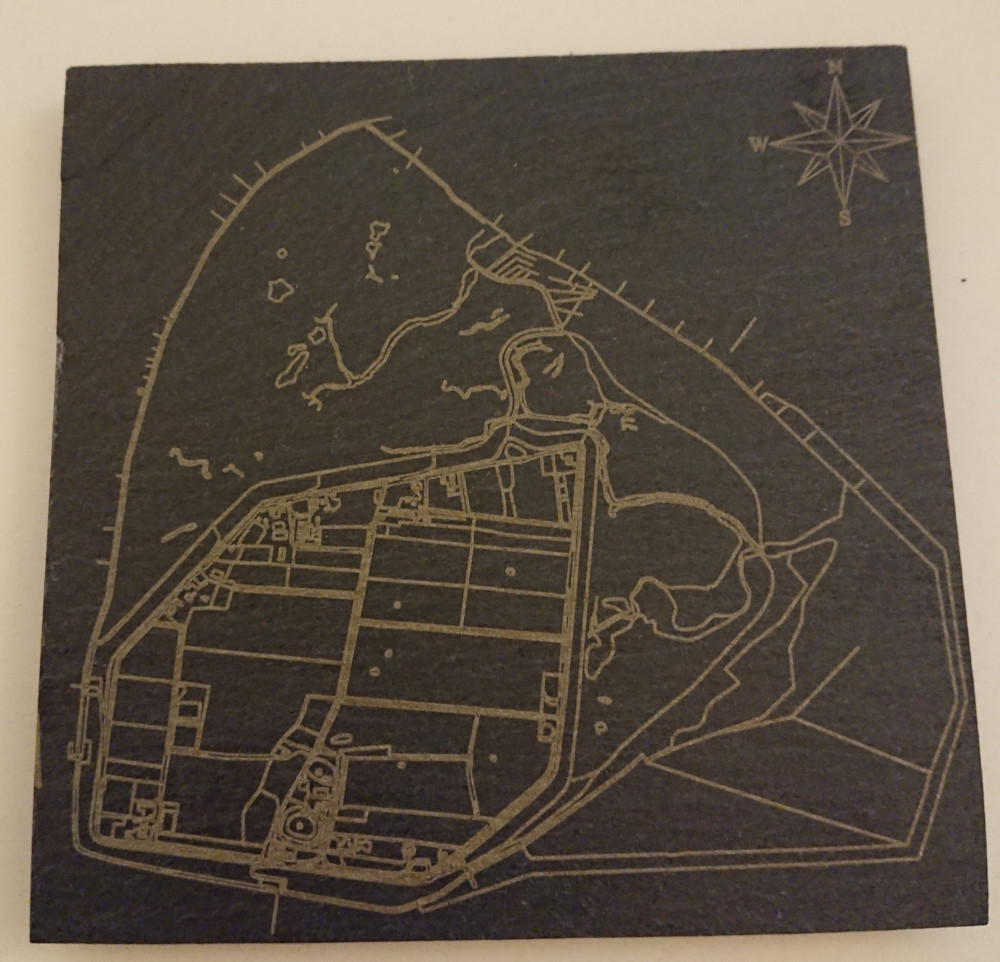
21 Elevation with qgis2threejs (It’s art, I swear!
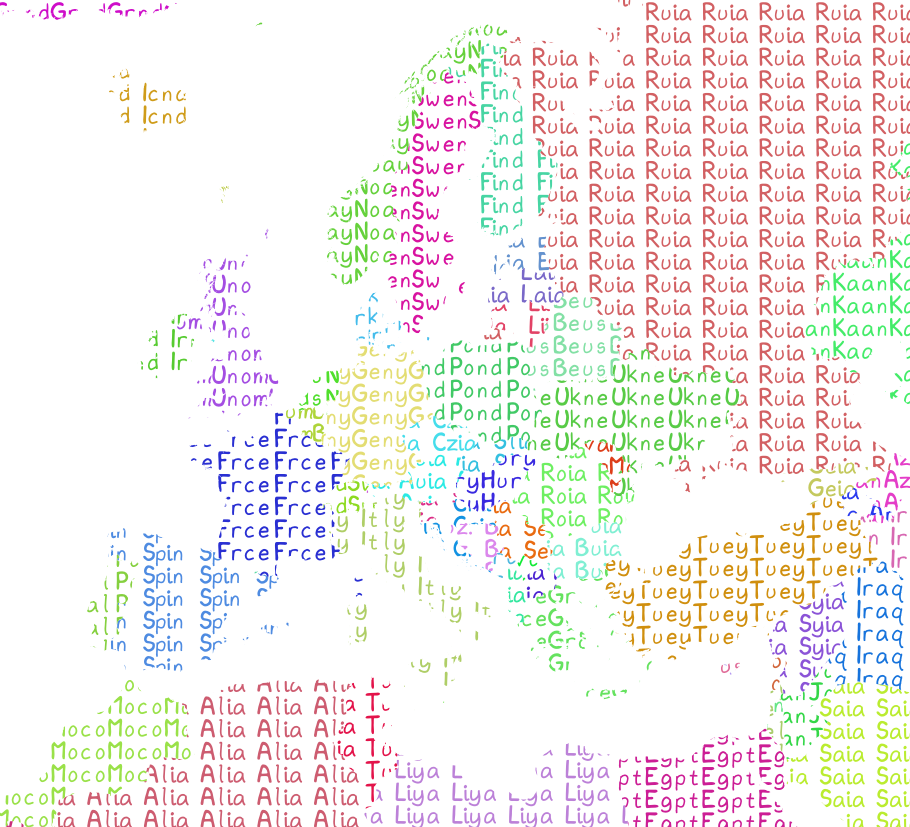
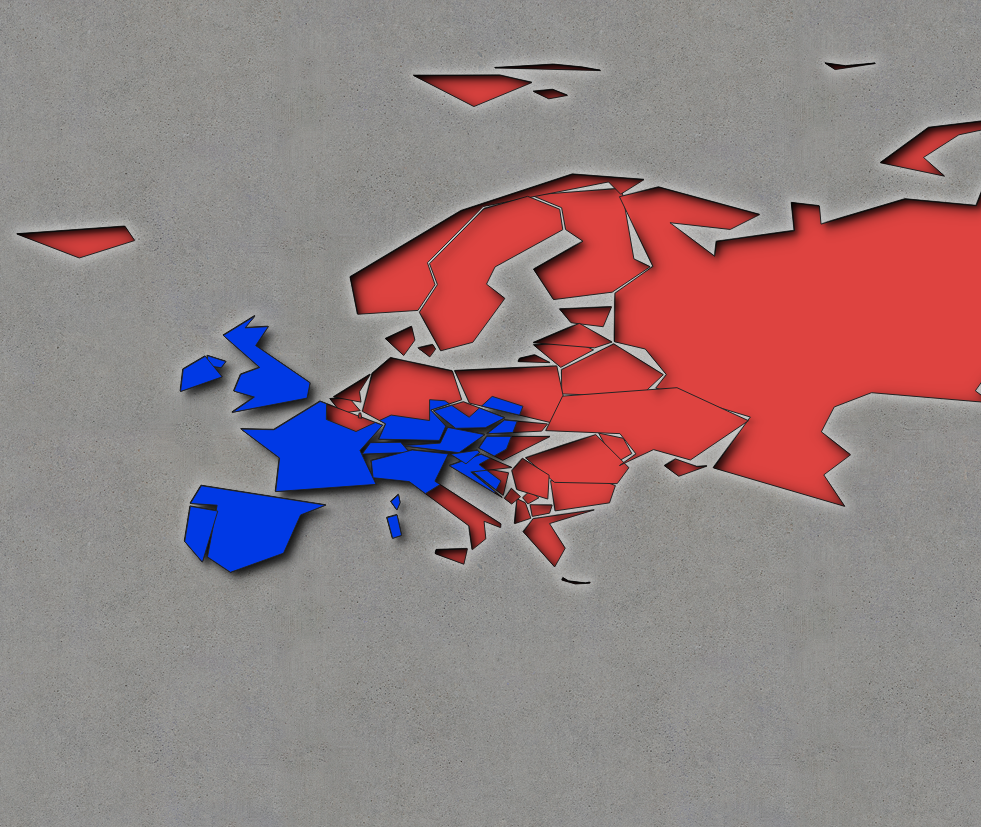
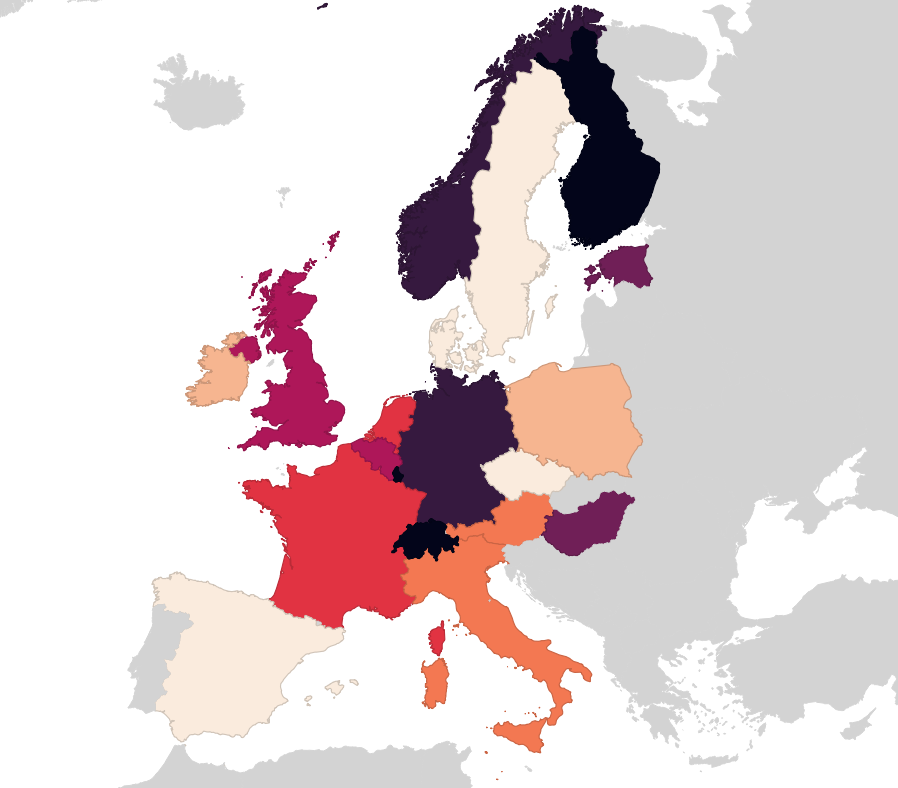
22 Boundaries: Inspired by Command and Conquer Red Alert. Background by Spiney (CC-BY 3.0 / CC-BY-SA 3.0, https://opengameart.org/node/12098)
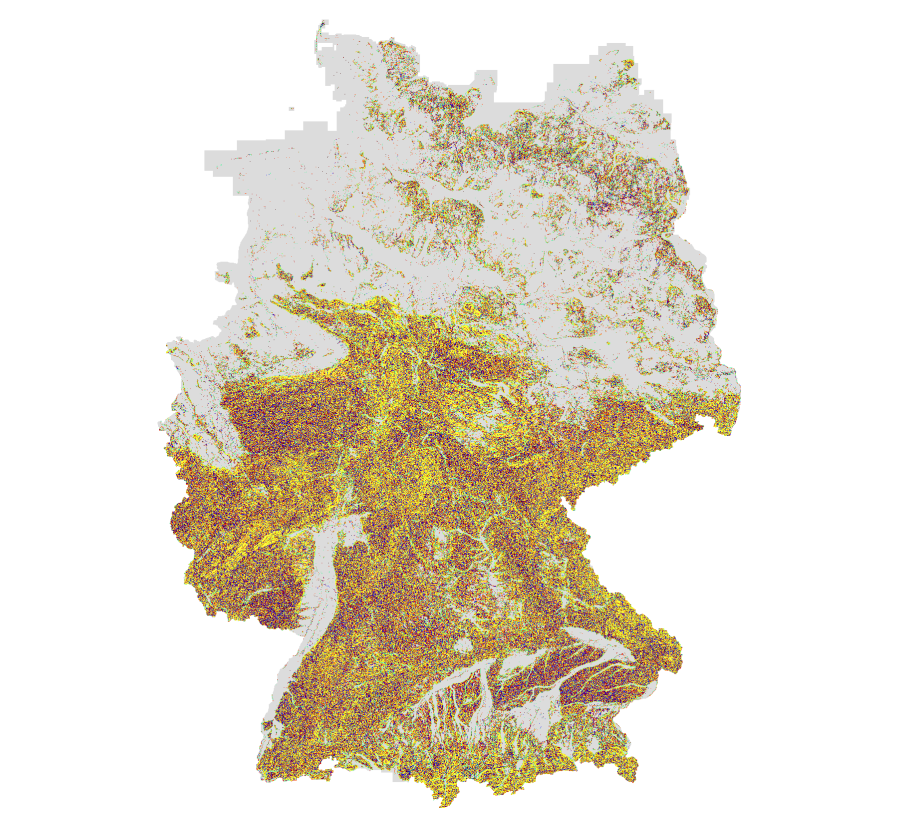
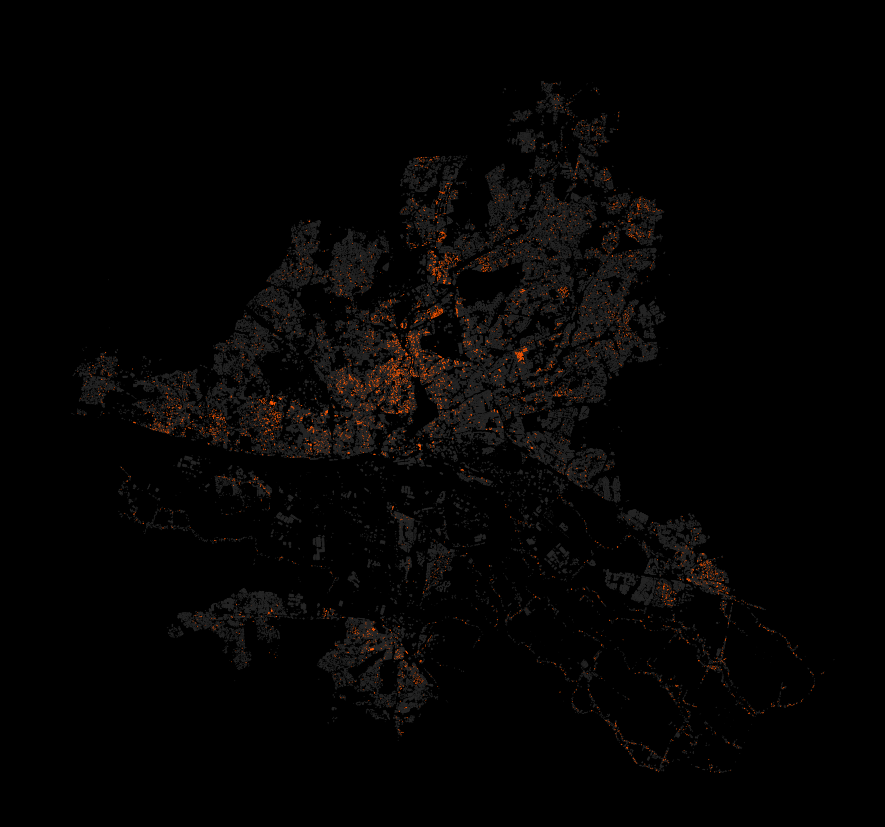
24 Historical: Buildings in Hamburg that were built before the war (at least to some not so great dataset). Data Lizenz: Datenlizenz Deutschland Namensnennung 2.0 (Freie und Hansestadt Hamburg, Landesbetrieb Geoinformation und Vermessung (LGV))
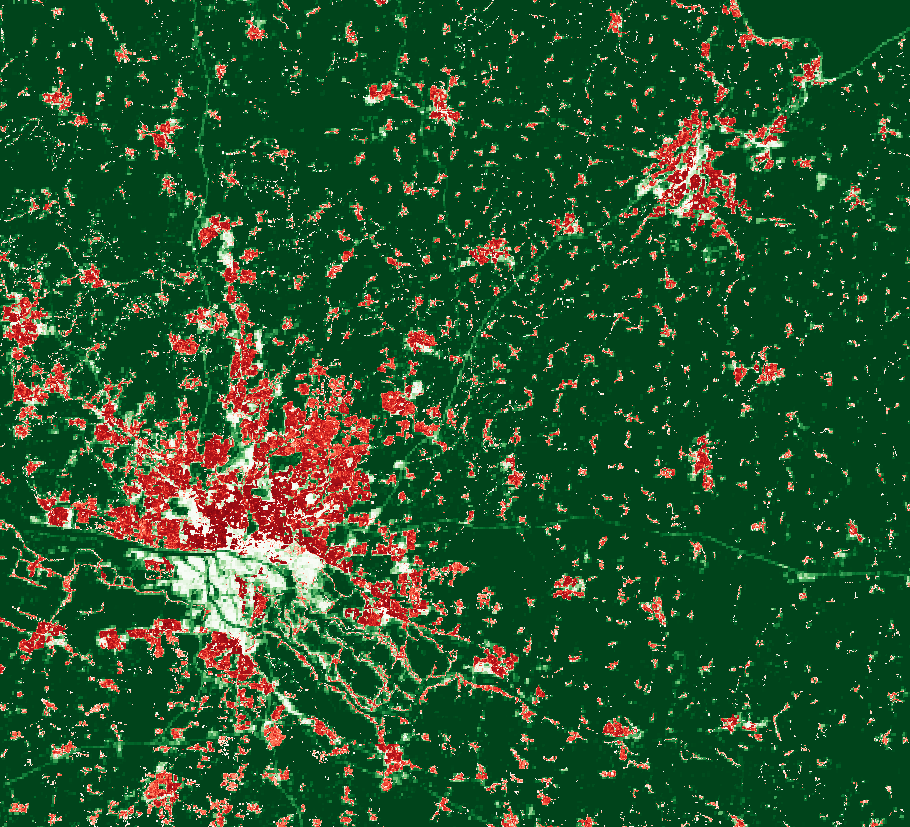
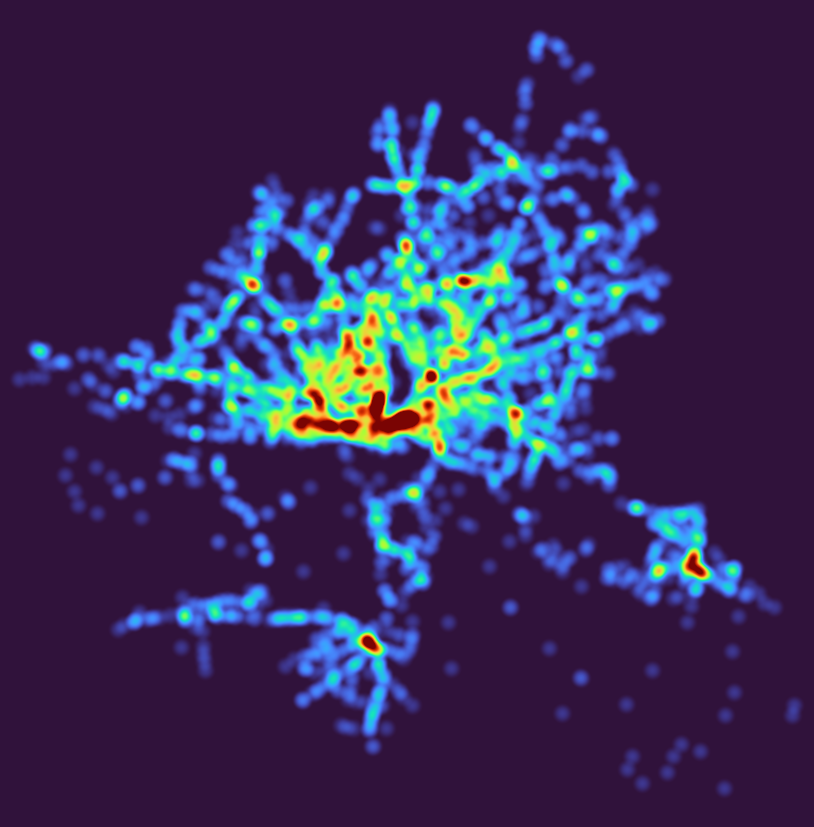
27 Heatmap: Outdoor advertisements (or something like that) in Hamburg. Fuck everything about that! Data Lizenz: Datenlizenz Deutschland Namensnennung 2.0 (Freie und Hansestadt Hamburg, Behörde für Verkehr und Mobilitätswende, (BVM))
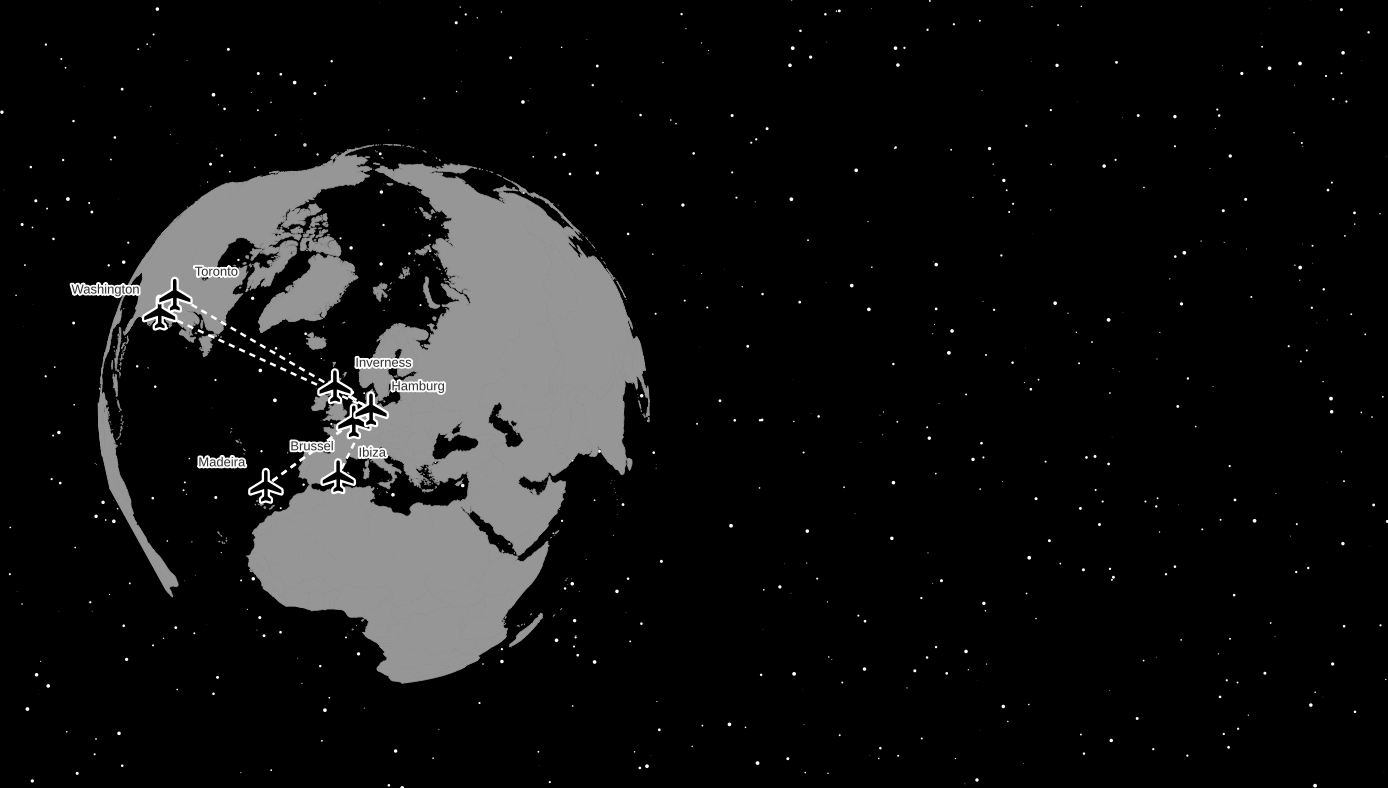
28 Earth not flat. Using my colleague’s Beeline plugin to create lines between the airports I have flown too and the Globe Builder plugin by @gispofinland to make a globe.
Raster Image Marker with https://opengameart.org/content/character-spritesheet-duck, vertical anchor at bottom, sprite choice between walking and running (doesn’t actually work) plus the frame via
Recorded by placing two windows side by side and zoom into separate, non-cached regions using: "xte "mousemove 640 440" "mouseclick 4" && xte "mousemove 1080 440" "mouseclick 4" in a loop.
Did this for an ex-colleague some months ago and forgot to share the how-to publically. We needed a visual representation of the current time in a layout that showed both a raster map (different layer per timeslice) and a timeseries plot of an aspect of the data (this was created outside QGIS).
Have lots of raster layers you want to iterate through. I have:
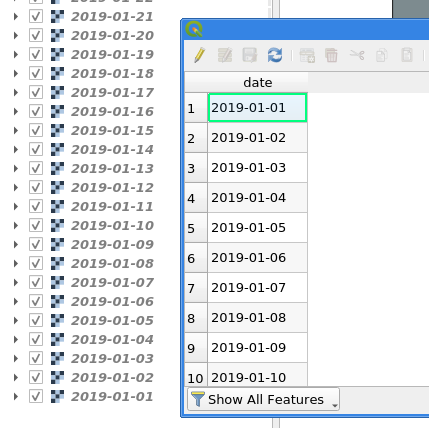
Create a new layer for your map extent. Draw your extent as geometry. Duplicate that geometry as many times as you have days. Alternatively you could of course have different geometries per day. Whatever you do, you need a layer with one feature per timeslice for the Atlas to iterate though. I have 30 days to visualise so I duplicated my extent 30 times.
Open the Field Calculator. Add a new field called date as string type (not as date type until some bug is fixed (sorry, did not make a note here, maybe sorting is/was broken?)) with an expression that represents time and orders chronologically if sorted by QGIS. For example: '2019-01-' || lpad(@row_number,2,0) (assuming your records are in the correct order if you have different geometries…)
Have your raster layers named the same way as the date attribute values.
Make a new layout.
For your Layout map check “Lock layers” and use date as expression for the “Lock layers” override. This will now select the appropriate raster layer, based on the attribute value <-> layer name, to display for each Atlas page.
Cool, if you preview the Atlas now you got a nice animation through your raster layers. Let’s do part 2:
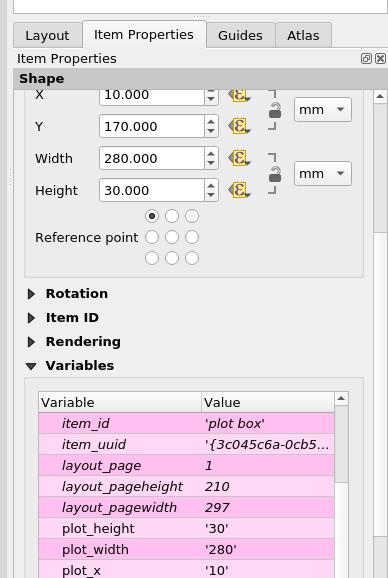
In your layout add your timeseries graph. Give it a unique ID, e. g. “plot box”. Set its width and height via new variables (until you can get those via an expression this is needed for calculations below).
Create a box to visualise the timeslice. Set its width to map_get(item_variables('plot box'), 'plot_width') / @atlas_totalfeatures. For the height and y use/adjust this expression: map_get(item_variables('plot box'), 'plot_height'). For x comes the magic:
with_variable(
     'days_total',
     day(to_date(maximum("date"))-to_date(minimum("date")))+1,
       -- number of days in timespan
       -- +1 because we need the number of days in total
       -- not the inbetween, day() to just get the number of days
     with_variable(
         'mm_per_day',
         map_get(item_variables('plot box'), 'plot_width') / @days_total,
         with_variable(
             'days',
             day(to_date(attribute(@atlas_feature, 'date'))-to_date(minimum("date"))),
               -- number of days the current feature is from the first day
               -- to_date because BUG attribute() returns datetime for date field
             @mm_per_day * @days + map_get(item_variables('plot box'), 'plot_x')
         )
     )
 )
This will move the box along the x axis accordingly.