Category Archives: GIS

One SRTMGL1 GeoTIFF to rule them all

NOTE: In up to date GDAL things might be easier AND I messed up with --config and -co below. Poke me to update it please.

So about half a year ago Lukas Martinelli asked about a global SRTM GeoTIFF. The SRTM elevation data is usually shared in many small tiles which can be ideal for some cases but annoying for others. I like downloading and processing big files so I took that as a challenge. It’s probably some mental thing. I never finished this blog post back then. It’s probably another mental thing. 8) Read on if you are interested in some GNU coreutils hackery as well as GDAL magick.

Here is how I did it. Endless thanks as usual to Even Rouault who fixed GDAL bugs and gave great hints. I learned more about GeoTIFFs and GDAL than I should have needed to know.

Downloading the source files

The source files are available at http://e4ftl01.cr.usgs.gov/SRTM/SRTMGL1.003/2000.02.11/ (warning, visiting this URL will make your browser cry and potentially render your system unresponsive). To download them you must create an NASA Earthdata Login at https://urs.earthdata.nasa.gov/users/new/. :\

********************************************************************************

                         U.S. GOVERNMENT COMPUTER

This US Government computer is for authorized users only.  By accessing this
system you are consenting to complete monitoring with no expectation of privacy.
Unauthorized access or use may subject you to disciplinary action and criminal
prosecution.

OMGOMGOMG. I am sure they would have used <blink> if accessibility guidelines allowed it. As I am not sure what their Terms of Service are, I will not give you a copy’n’paste ready line to download them all. wget or aria2 work well. You should get 14297 files with a total size of 98G.

Inspecting the ZIP files and preparing for GDAL’s vsizip

Each of those ZIP files has just a single file “.hgt” inside. GDAL specifically has support for the “SRTM HGT Format“, so we know it can read those files. We just need to extract them. (If you clicked that link you see that with GDAL 2.2 it will support directly loading the data from the ZIPs, that’s just Even being awesome.)

We don’t want to uncompress all those files just because we want to build a GeoTIFF from them later, do we? Luckily GDAL has a vsizip thingie which allows it to read files inside zip archives. Wicked! For this we need the “deep” paths to the files though, for example e4ftl01.cr.usgs.gov/SRTM/SRTMGL1.003/2000.02.11/N29E000.SRTMGL1.hgt.zip/N29E000.hgt.

The files inside the archives are always simply the same filename minus the “.SRTMGL1” and the .zip extension. Perfect, now we know all the files from inside the ZIPs! Right? Nope. Unfortunately some (17) of the archives do include the “.SRTMGL1” bit in their files, for example N38E051.SRTMGL1.hgt… >:(

That’s why we need to look into each zip file and determine the filename inside. (Alternatively *you* could extract them all after all, you with your fancy, huge SSD.)

We can simply use `unzip` with the `-t` switch to make it show what’s inside (and as a “free” benefit it will also check the file’s integrity for us). `tee` is used here to save the output to a file. This will take a while as it needs to read through all the files…

$ unzip -t "e4ftl01.cr.usgs.gov/SRTM/SRTMGL1.003/2000.02.11/*.SRTMGL1.hgt.zip" | tee unzip-t.log

...

Archive: e4ftl01.cr.usgs.gov/SRTM/SRTMGL1.003/2000.02.11/N29E000.SRTMGL1.hgt.zip
testing: N29E000.hgt OK
No errors detected in compressed data of e4ftl01.cr.usgs.gov/SRTM/SRTMGL1.003/2000.02.11/N29E000.SRTMGL1.hgt.zip.

Archive: e4ftl01.cr.usgs.gov/SRTM/SRTMGL1.003/2000.02.11/N27E033.SRTMGL1.hgt.zip
testing: N27E033.hgt OK
No errors detected in compressed data of e4ftl01.cr.usgs.gov/SRTM/SRTMGL1.003/2000.02.11/N27E033.SRTMGL1.hgt.zip.

Archive: e4ftl01.cr.usgs.gov/SRTM/SRTMGL1.003/2000.02.11/N45E066.SRTMGL1.hgt.zip
testing: N45E066.hgt OK
No errors detected in compressed data of e4ftl01.cr.usgs.gov/SRTM/SRTMGL1.003/2000.02.11/N45E066.SRTMGL1.hgt.zip.

14297 archives were successfully processed.

Yay, no errors!

In the output we see the path to the archive and we see the name of the file inside. With some sed and grep we can easily construct “deep” paths.

First we remove the status lines, the blank lines and the very last full status line with `grep`:

$ cat unzip-t.log | grep -v -e "No errors" -e '^$' -e 'successfully processed'

Archive: e4ftl01.cr.usgs.gov/SRTM/SRTMGL1.003/2000.02.11/N12E044.SRTMGL1.hgt.zip
testing: N12E044.hgt OK
Archive: e4ftl01.cr.usgs.gov/SRTM/SRTMGL1.003/2000.02.11/N29W002.SRTMGL1.hgt.zip
testing: N29W002.hgt OK
Archive: e4ftl01.cr.usgs.gov/SRTM/SRTMGL1.003/2000.02.11/N45E116.SRTMGL1.hgt.zip
testing: N45E116.hgt OK

Then we concatenate every consecutive two lines into one line with `paste` (I LOVE THIS 1 TRICK!):

$ cat unzip-t.log | grep -v -e "No errors" -e '^$' -e 'successfully processed' | paste - -

Archive: e4ftl01.cr.usgs.gov/SRTM/SRTMGL1.003/2000.02.11/N12E044.SRTMGL1.hgt.zip testing: N12E044.hgt OK
Archive: e4ftl01.cr.usgs.gov/SRTM/SRTMGL1.003/2000.02.11/N29W002.SRTMGL1.hgt.zip testing: N29W002.hgt OK
Archive: e4ftl01.cr.usgs.gov/SRTM/SRTMGL1.003/2000.02.11/N45E116.SRTMGL1.hgt.zip testing: N45E116.hgt OK

Finally we strip things away with sed (I don’t care that you would do it differently, this is how I quickly did it with my flair of hammering) and direct the output into a new file called `zips`:

$ cat unzip-t.log | grep -v -e "No errors" -e '^$' -e 'successfully processed' | paste - - | sed -e 's#Archive:[ ]*##' -e 's#\t[ ]*testing: #/#' -e 's#[ ]*OK##' > zips

e4ftl01.cr.usgs.gov/SRTM/SRTMGL1.003/2000.02.11/N12E044.SRTMGL1.hgt.zip/N12E044.hgt
e4ftl01.cr.usgs.gov/SRTM/SRTMGL1.003/2000.02.11/N29W002.SRTMGL1.hgt.zip/N29W002.hgt
e4ftl01.cr.usgs.gov/SRTM/SRTMGL1.003/2000.02.11/N45E116.SRTMGL1.hgt.zip/N45E116.hgt

Yay, we have all the actual inside-zip paths now!

If you are curious, you can try gdalinfo with those now. You need to prepend /vsizip/ to the path to make it read inside zip files.

$ gdalinfo /vsizip/e4ftl01.cr.usgs.gov/SRTM/SRTMGL1.003/2000.02.11/N12E044.SRTMGL1.hgt.zip/N12E044.hgt

Driver: SRTMHGT/SRTMHGT File Format
Files: /vsizip/e4ftl01.cr.usgs.gov/SRTM/SRTMGL1.003/2000.02.11/N12E044.SRTMGL1.hgt.zip/N12E044.hgt
Size is 3601, 3601
Coordinate System is:
GEOGCS["WGS 84",
    DATUM["WGS_1984",
        SPHEROID["WGS 84",6378137,298.257223563,
            AUTHORITY["EPSG","7030"]],
        AUTHORITY["EPSG","6326"]],
    PRIMEM["Greenwich",0,
        AUTHORITY["EPSG","8901"]],
    UNIT["degree",0.0174532925199433,
        AUTHORITY["EPSG","9122"]],
    AUTHORITY["EPSG","4326"]]
Origin = (43.999861111111109,13.000138888888889)
Pixel Size = (0.000277777777778,-0.000277777777778)
Metadata:
  AREA_OR_POINT=Point
Corner Coordinates:
Upper Left  (  43.9998611,  13.0001389) ( 43d59'59.50"E, 13d 0' 0.50"N)
Lower Left  (  43.9998611,  11.9998611) ( 43d59'59.50"E, 11d59'59.50"N)
Upper Right (  45.0001389,  13.0001389) ( 45d 0' 0.50"E, 13d 0' 0.50"N)
Lower Right (  45.0001389,  11.9998611) ( 45d 0' 0.50"E, 11d59'59.50"N)
Center      (  44.5000000,  12.5000000) ( 44d30' 0.00"E, 12d30' 0.00"N)
Band 1 Block=3601x1 Type=Int16, ColorInterp=Undefined
  NoData Value=-32768
  Unit Type: m

Hooray! GDAL reads the hgt file from inside its zip!

We need to prepend all the paths with `/vsizip/` so let’s do that:

$ sed 's#^#/vsizip/##' zips > vsizips

/vsizip/e4ftl01.cr.usgs.gov/SRTM/SRTMGL1.003/2000.02.11/N12E044.SRTMGL1.hgt.zip/N12E044.hgt
/vsizip/e4ftl01.cr.usgs.gov/SRTM/SRTMGL1.003/2000.02.11/N29W002.SRTMGL1.hgt.zip/N29W002.hgt
/vsizip/e4ftl01.cr.usgs.gov/SRTM/SRTMGL1.003/2000.02.11/N45E116.SRTMGL1.hgt.zip/N45E116.hgt

Unfortunately those 17 misnamed files from earlier need special treatment… This is what my notes say, not sure what it was supposed to do. If you are recreating this all, please just ask me and I will look at it again. For now, let’s just pretend that this leads to a file called `hgtfiles` in which all the paths are perfect and all the files are perfect.


grep -v 'SRTMGL1.hgt$' vsizips > vsizipswithoutmisnamedfiles
mkdir misnamedfiles
cd misnamedfiles/
nano ../listofmisnamedfiles # insert the paths to those 17 zips here #TODO
while read filename; do unzip "../${filename}"; done < ../listofmisnamedfiles
rename 's/SRTMGL1.//' *.hgt
cd ..
find misnamedfiles/ -type f > listofmisnamedfileshgt
cat listofmisnamedfileshgt vsizipswithoutmisnamedfiles > hgtfiles

As I said above though, go with a recent GDAL and this is all much easier. Even even included a check for the different filenames inside, how can you not like that guy!

Building a Virtual Raster Table

Virtual Raster Tables (VRT) are some kind of files that pretend to be rasters. They are awesome. Here we use a VRT that simply turns all the small rasters we have into one big ass raster.

Ok, ready to create a Virtual Raster Table!

$ time gdalbuildvrt -input_file_list hgtfiles srtmgl1.003.vrt

0...10...20...30...40...50...60...70...80...90...100 - done.

real 0m22.679s
user 0m19.250s
sys 0m3.105s

Done.

You could go ahead and use this for your work/leisure now. But remember, it is tens of gigabytes of data so if you do not use it at a 1:1 scale things will not be fun and might fry your cat. You want overviews/pyramids.

Turning the VRT into a GeoTIFF (Optional)

Let’s make a HUGEGEOTIFF because that’s cool! You don’t have to, instead you could build overviews for the .vrt file.

We want it quick to read and small so I used DEFLATE, TILED and the horizontal predictor. I ran this on a weak i7 with 2G of RAM and can’t remember what the worst bottleneck was. Probably CPU.

$ time gdal_translate -co NUM_THREADS=ALL_CPUS --config PREDICTOR 2 -co COMPRESS=DEFLATE -co TILED=YES -co BIGTIFF=YES srtmgl1.003.vrt srtmgl1.003.vrt.tif

Input file size is 1296001, 417601
0...10...20...30...40...50...60...70...80...90...100 - done.

real 231m57.961s
user 503m23.044s
sys 3m14.600s

If you are courageous you can load that file in your GIS now. But again, unless you watch it at a 1:1 scale or something close to that it WILL not be much fun and potentially expose weaknesses in your GIS and fill up your system’s memory and crash and you had no unsaved work open, didn’t you?

Building Overviews

Overviews aka pyramids are usually about 1/3 the size of the full image. If they are not, you probably used different compression settings. This was the step that I expected to be just boring to wait for, but it turned out the most problematic. I tried all available free tools but none worked properly with an input this big. With GDAL we found a workaround after a while.

gdaladdo has problems building multiple overview levels with a file this big… The trick is to built the overviews sequentially, not in one invocation. The best solution at the moment was building overviews for overviews for overviews and so on until you reach a comfortable size. Something like:


gdaladdo -ro srtmgl1.003.tif 2
gdaladdo -ro srtmgl1.003.tif.ovr 2
gdaladdo -ro srtmgl1.003.tif.ovr.ovr 2
gdaladdo -ro srtmgl1.003.tif.ovr.ovr.ovr 2
gdaladdo -ro srtmgl1.003.tif.ovr.ovr.ovr.ovr 2 4 8 16 32 64 128 256 512

I used the following parameters:
gdaladdo -oo NUM_THREADS=ALL_CPUS --config GDAL_NUM_THREADS ALL_CPUS --config GDAL_CACHEMAX 2048 --config COMPRESS_OVERVIEW DEFLATE --config PREDICTOR_OVERVIEW 2 --config BIGTIFF_OVERVIEW YES -ro

ovrovrovrovrovrovrovrovrovrovr

Apparently gdaladdo automatically makes them tiled, which is good. I used https://gist.github.com/springmeyer/3007985 to find out.

Creating overviews took just about 3 hours with this weird trick. So, in total the processing just takes half a day.

Download

Enjoy! https://www.datenatlas.de/geodata/public/srtmgl1/. I impose no license/copyright/whatever on this derivative work.

TODO

Hillshading? Slope? You do it!

Found a better, faster way? You blog it!

We could add the overviews to the main image with `gdal_translate srtmgl1.003.tif srtmgl1.003.withovr.tif -co COPY_SRC_OVERVIEWS=YES [other options]` says Even.

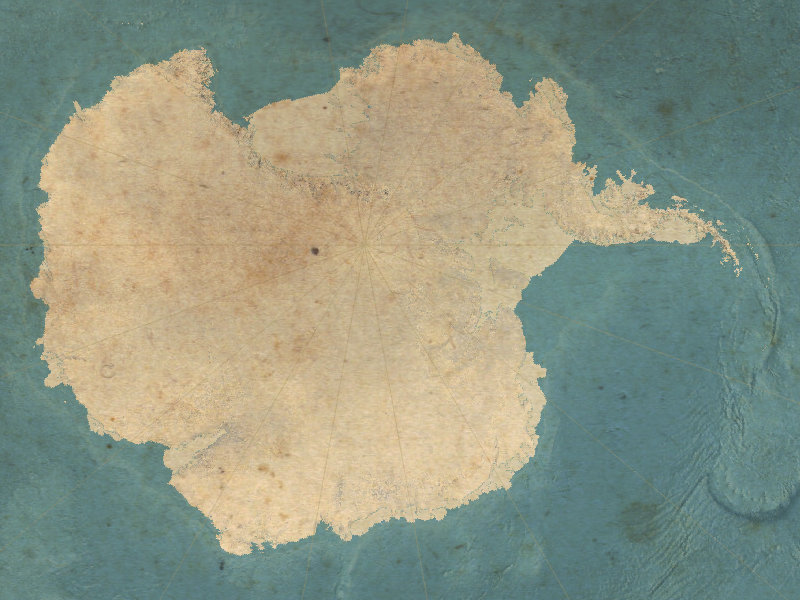
This Stain On Old Paper Looks Just Like Germany OMG!

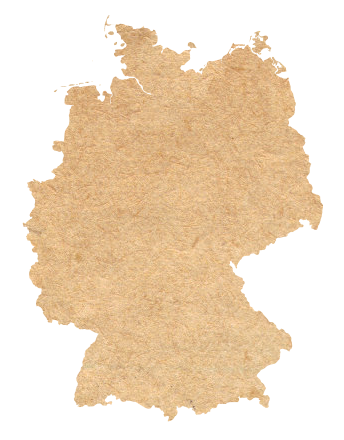
Following Doing things to the whole map canvas in QGIS and adding some blending to the mix (he-he), I ended up with this map. Nothing you could not do with simple post-processing in a raster image editor or even QGIS’ map composer I guess.

stain

It was simply the result of playing around, there probably is a faster or more efficient way.

First give your geometries some fancy texture with Raster image fill (left). Then constrict its display to just some blurry borders by using a grey fill, Blur draw effect with maximum strength and the Dodge Layer blending mode (right).

papergermanyborder

You could probably skip the texture for the geometry but I did not manage to get a similarly nice effect with a Simple fill.

Use the trick from Doing things to the whole map canvas in QGIS to fill your canvas with a polygon and give that a nice texture as well. Use Multiply as Layer blending mode and get social media hype for that unbelievable stain can you believe it looks like that???

From the same session comes this beauty (mostly due to Tom Patterson’s shading of course ;) ):
antarctica

Doing things to the whole map canvas in QGIS

Due to a minor bug in QGIS you need a very recent testing build. 2.16.3 is not recent enough but 2.16.4 would be.

For cool tricks like vignetting or other eye candy, having a geometry that spans the whole map canvas in QGIS can be very useful.

Using the @map_* Variables available in expressions in combination with a Geometry generator style allows you to do this.

@map_extent_center returns a Point geometry of the current map canvas center, with x(@map_extent_center) and y(@map_extent_center) you get the x and y coordinates of it in the current CRS.
@map_extent_width and @map_extent_height return the width respectively height of the map canvas in CRS units.

Our goal is to create a polygon that exactly matches the map canvas extents. Some simple math gets you there.

First create Points for each of the corners by alternating the x+/-width and y+/-height. Then create a Line from all of them (the last point does not need to be the first again, make_polygon does that for you). And use the line as outer ring for a Polygon.

make_polygon(
 make_line(
  make_point(x(@map_extent_center)-@map_extent_width/2, y(@map_extent_center)-@map_extent_height/2),
  make_point(x(@map_extent_center)+@map_extent_width/2, y(@map_extent_center)-@map_extent_height/2),
  make_point(x(@map_extent_center)+@map_extent_width/2, y(@map_extent_center)+@map_extent_height/2),
  make_point(x(@map_extent_center)-@map_extent_width/2, y(@map_extent_center)+@map_extent_height/2)
 )
)

To actually see this, you need to use the style on a layer with at least one feature that is always visible where you want to focus your map canvas. Just make a polygon layer with one polygon that encloses the whole area. The layer must be in the same CRS as the project I think.

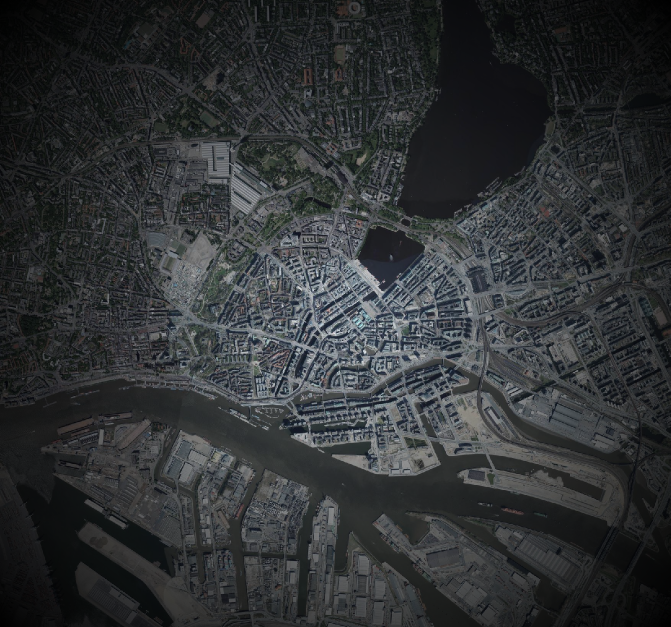
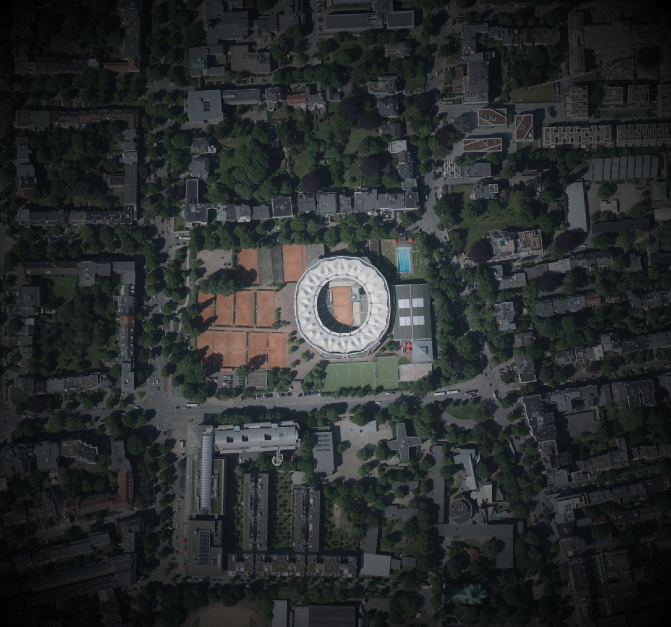
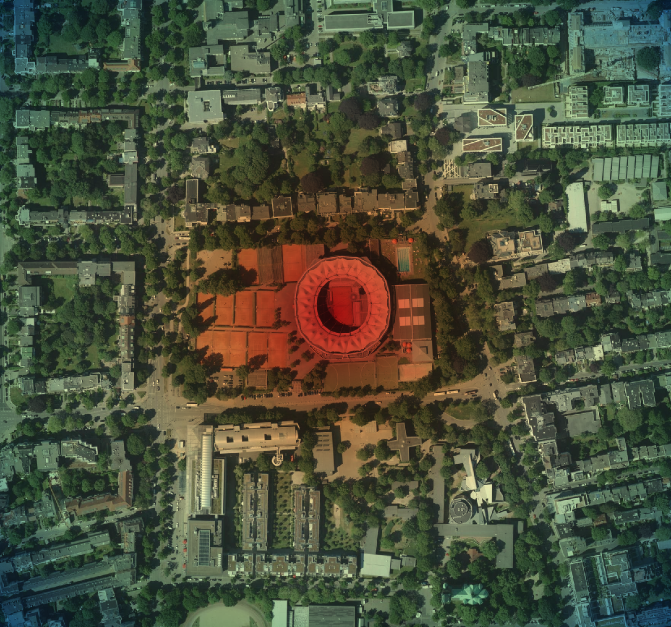
You now have a Polygon that corresponds with the map canvas. Give it a radial gradient fill with some transparency and party!

radialgradient
hh-bw
schiff-bw
stadion-bw
stadion-red

All aerial images in the examples are

Lizenz: Datenlizenz Deutschland Namensnennung 2.0
Namensnennung: Freie und Hansestadt Hamburg, Landesbetrieb Geoinformation und Vermessung
http://daten-hamburg.de/geographie_geologie_geobasisdaten/digitale_orthophotos/DOP20/DOP20_HH_fruehjahrsbefliegung_2015.zip

To make sure the feature you want to highlight is in the center, you could use another layer and @map_extent_center.

Yes, this totally is a hack but it’s fun!

Fancy Free File Formats For Hamburg’s Open Geodata

While this is about data of the city of Hamburg, Germany, I decided to post in English as GeoPackage Propaganda should be accessible. ;)

I am casually working on converting open geodata released via the Transparenzportal Hamburg to more usable GeoPackages, GeoTIFFs and similar formats with free and open-source tools like GDAL and GMT where possible. This includes things like orthophotos, ALKIS, addresses, DEM, districts etc. You can get a list of most available source data here but there are some datasets “hidden” in other categories as well. The data is usually released in GML or as gridded files (e.g. JPEG or XYZ tiles/files). While this is pretty much perfect as source formats, working with them is cumbersome. My goal is to make this data more accessible for anyone in tools like QGIS.

For now you can find the 20cm orthophotos for 2013-2015 and the 1m DEM in https://www.datenatlas.de/geodata/public/hamburg/. Mind the licenses, see the readme file for a bit of info. More to come, I want to plan the pipeline a bit better first though. There should be a full script & log from source to GeoPackage for each file.

I will also provide mirrors of the source files. If you want to collaborate, please contact me. Apart from Hamburg I will also add free/open datasets for the whole of Germany, things related to (nearby) bathymetry and some global ones. If you want Shapefiles, ECW, MrSID or similar, you can pay me for converting.

e-foto (free GNU/GPL educational digital photogrammetric workstation) on Archlinux

I wrote this a year ago and meant to write more. Turns out I did not but it still works. You might need to figure out dependencies yourself. Here you go:

e-foto is a free GNU/GPL educational digital photogrammetric workstation in active development.

svn checkout https://svn.code.sf.net/p/e-foto/code/trunk e-foto-code
cd e-foto-code/c
wget http://download.osgeo.org/shapelib/shapelib-1.3.0.tar.gz
tar xfv shapelib-1.3.0.tar.gz
mv shapelib-1.3.0 shapelib
cd ..
mkdir build
cd build
qmake-qt4 ../e-foto.pro 
make

Ready to run in

../bin/e-foto

Oakland: All license plate reader data (ALPR)

WTF!

https://data.oaklandnet.com/browse?q=alpr via https://news.ycombinator.com/item?id=10642139

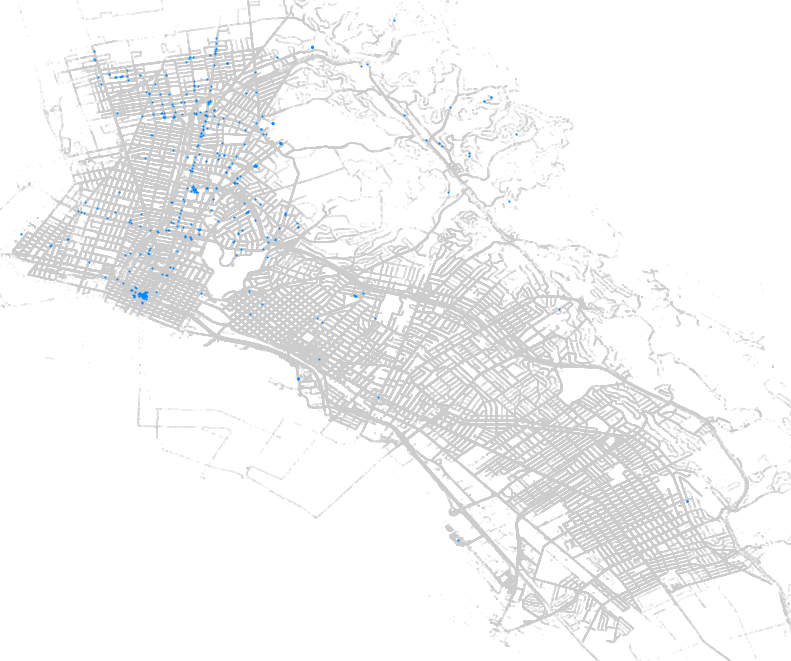
817159 timestamped car plate locations.

oakland scans
oakland selected scans

Pages:

https://data.oaklandnet.com/Public-Safety/All-License-Plate-Reader-Data-ALPR-September-23-20/6dab-n9nd
https://data.oaklandnet.com/Public-Safety/All-license-plate-reader-data-ALPR-04-01-2014-thru/k76g-27ne
https://data.oaklandnet.com/Public-Safety/All-license-plate-reader-data-ALPR-3-1-2013-4-1-20/m64r-jeei
https://data.oaklandnet.com/Public-Safety/All-license-plate-reader-data-ALPR-3-19-2014-3-31-/wy2w-ue82
https://data.oaklandnet.com/Public-Safety/All-license-plate-reader-data-ALPR-4-1-14-thru-5-3/7axi-hi5i
https://data.oaklandnet.com/Public-Safety/All-license-plate-reader-data-ALPR-5-13-2012-7-3-2/f28j-9q95
https://data.oaklandnet.com/Public-Safety/All-license-plate-reader-data-ALPR-7-6-2011-12-19-/7xz6-yzxz
https://data.oaklandnet.com/Public-Safety/All-license-plate-reader-data-ALPR-8-6-2012-8-12-2/gyu7-qpwz
https://data.oaklandnet.com/Public-Safety/All-license-plate-reader-data-ALPR-8-26-2012-9-19-/bd9f-4pn8
https://data.oaklandnet.com/Public-Safety/All-license-plate-reader-data-ALPR-9-15-2012/vwcs-329i” clas
https://data.oaklandnet.com/Public-Safety/All-license-plate-reader-data-ALPR-10-20-2012-11-2/cyhz-jk8v
https://data.oaklandnet.com/Public-Safety/All-license-plate-reader-data-ALPR-11-20-2012-12-3/jxx3-67d2
https://data.oaklandnet.com/Public-Safety/All-license-plate-reader-data-ALPR-12-19-2013-1-31/h4qp-hsyy
https://data.oaklandnet.com/Public-Safety/All-license-plate-reader-data-ALPR-12-23-2010-thru/t7dd-x7dh

grab.sh:

ids=”6dab-n9nd
7axi-hi5i
7xz6-yzxz
bd9f-4pn8
cyhz-jk8v
f28j-9q95
gyu7-qpwz
h4qp-hsyy
jxx3-67d2
k76g-27ne
m64r-jeei
t7dd-x7dh
vwcs-329i
wy2w-ue82″

for id in ${ids}
do
echo “Grabbing ${id}”
wget -a wget.log -x –content-disposition “https://data.oaklandnet.com/api/views/${id}/rows.csv?accessType=DOWNLOAD”
# screw excel wget -a wget.log -x –content-disposition “https://data.oaklandnet.com/api/views/${id}/rows.csv?accessType=DOWNLOAD&bom=true”
wget -a wget.log -x –content-disposition “https://data.oaklandnet.com/api/views/${id}/rows.json?accessType=DOWNLOAD”
wget -a wget.log -x –content-disposition “https://data.oaklandnet.com/api/views/${id}/rows.pdf?accessType=DOWNLOAD”
wget -a wget.log -x –content-disposition “https://data.oaklandnet.com/api/views/${id}/rows.rdf?accessType=DOWNLOAD”
wget -a wget.log -x –content-disposition “https://data.oaklandnet.com/api/views/${id}/rows.rss?accessType=DOWNLOAD”
wget -a wget.log -x –content-disposition “https://data.oaklandnet.com/api/views/${id}/rows.xls?accessType=DOWNLOAD”
wget -a wget.log -x –content-disposition “https://data.oaklandnet.com/api/views/${id}/rows.xlsx?accessType=DOWNLOAD”
wget -a wget.log -x –content-disposition “https://data.oaklandnet.com/api/views/${id}/rows.xml?accessType=DOWNLOAD”
done

exit

Be aware that only the CSV format is guaranteed to have all records. At least that’s what some files say.

$ sed ‘s#,.*##g’ *.csv | sort | uniq | wc -l
817159

sed ‘s#,.*##g’ *.csv | sort | uniq -c | sort -h | tail
grep -h ‘^PLATENUMBER,’ *.csv | sed ‘s#,”(#,#g’ | sed ‘s#)”##’
grep -hEo “\(37.*\)\”” *.csv | sed ‘s#[()” ]*##g’

Happy stalking :(

UTM coordinate grids of Hamburg

The coordinates are wrong, I should have be xmin and ymin to match the official grid. Will update the PDFs soonish, sorry!

The LGV offers their official UTM grid for Hamburg in the Transparenzportal. Since many datasets are indexed by those grid tiles, it can be handy to have a quick references. Queue QGIS!

Load the layers “utm_raster1km any” and “utm_raster2km any” of the GML file. The CRS is EPSG:25832. Set their styles to have no fill.

Label with substr(x_min($geometry),0,4) || '\n' || substr(y_min($geometry),0,5) to truncate the coordinate display to just the interesting bits, the three leading numbers of X and the four leading numbers of Y.

Print them. You now have nice maps of the grid that you can use as reference when browsing through files with names like dgm1_32552_5936_2_fhh.xyz, LoD1_571_5939_1_HH.xml or dop20c_32576_5953.jpg (ignore the leading 32…).

I added the Stadtteile as background (and Wished QGIS could style by the 4 color theorem).

Click to download PDFs (they should be DIN A4, ask the composer why they are not):
1km2km

Converting coordinates with cs2cs

In the spirit of Blog Little Things and after reading WEBKID’s You Might Not Need QGIS earlier, here you go:

So you have thousands or millions of coordinates in “the wrong” or “that stupid” coordinate reference system and want to convert them to “the one you need”? Easily done with proj‘s cs2cs tool. You feed it a list of coordinates and tell it how you want them transformed and put out.

Let’s say you have these crazy accurate super coordinates in EPSG:4326 (WGS84) in a file called MyStupidCoordinates.txt (for example from copying columns out of Excel).


9.92510775592794303 53.63833616755876932
9.89715616602172332 53.61639299685715798
9.91541274879985579 53.63589289755918799
9.91922922611725966 53.63415202989637010
9.92072211107566382 53.63179675033637750
9.89998015840083490 53.62284810375095390
9.90427723676020832 53.60740624866674153
9.95012889485460583 53.64563499608360075
9.89590860878436196 53.62979225409544171
9.92944379841924452 53.60061248161031955

and you want them in the much superior and wonderfully metric EPSG:25832 (ETRS89 / UTM zone 32N). You simply use +init=sourceCRS +to +init=targetCRS. if you have no idea what CRS your coordinates are in, enjoy 5 minutes with http://projfinder.com/ and you will either know or you might want to take a walk (don’t forget to try them flipped though).

cs2cs +init=epsg:4326 +to +init=epsg:25832 MyStupidCoordinates.txt

and it will print


561164.00 5943681.64 0.00
559346.79 5941216.81 0.00
560526.52 5943401.54 0.00
560781.36 5943211.12 0.00
560883.46 5942950.37 0.00
559524.51 5941937.29 0.00
559830.54 5940223.00 0.00
562807.40 5944515.43 0.00
559245.50 5942706.43 0.00
561505.49 5939488.65 0.00

You probably want more decimal places though, since your input coordinates were accurate down to the attodegree. For this, you can specify the output format with -f

cs2cs +init=epsg:4326 +to +init=epsg:25832 -f "%.17f" MyStupidCoordinates.txt


561164.00100000295788050 5943681.64279999211430550 0.00000000000000000
559346.79200000269338489 5941216.80899999570101500 0.00000000000000000
560526.52400000276975334 5943401.53899999428540468 0.00000000000000000
560781.36300000245682895 5943211.12199999392032623 0.00000000000000000
560883.46400000224821270 5942950.37499999348074198 0.00000000000000000
559524.51200000231619924 5941937.29399999510496855 0.00000000000000000
559830.54200000269338489 5940223.00299999490380287 0.00000000000000000
562807.39800000295508653 5944515.43399999290704727 0.00000000000000000
559245.50000000221189111 5942706.42899999395012856 0.00000000000000000
561505.48800000257324427 5939488.65499999187886715 0.00000000000000000

Perfect!

You could direct these transformed coordinates into a new file called MyCoolCoordinates.txt by adding a redirection of its output:

cs2cs +init=epsg:4326 +to +init=epsg:25832 MyStupidCoordinates.txt > MyCoolCoordinates.txt

You can find out more about cs2cs by reading its manpage:

man cs2cs

PS: You can handle that Z coordinate, right?

Fancy shaded and scaled contour lines in QGIS

Daniel P. Huffman shared this gorgeous map earlier. ArcMap just got the functionality to create such contour lines.

CFnWnA5UkAAuFm9

Naturally I had to try to re-create that style in QGIS. I semi-succeeded:

You have a DEM, eg mtsthelens_after.zip. Generate a hillshade from DEM. Generate contour lines from DEM.
dem hillshade contours

Split the lines by segment, for example with the “Network” plugin. Select all features on your layer and then use its “Split” function.
Calculate the azimuth of each line. See this magical formula (I wish QGIS would have a function ready).
Rotate the angle according to your hillshade light angle. For example:
CASE
 WHEN ("azimuth"+270) > 360
  THEN ("azimuth"+270-360)/500
 ELSE ("azimuth"+270)/500
END

And use that to scale your lines’ widths (the 500 is a constant factor here to get them small enough).

Disable all layers but hillshade and contour lines.
Move hillshade above contour lines.
Set map background to black (equals 0 in the blending multiplication later).
Use black to white as color ramp for the hillshade.
Set hillshade’s blending mode to multiply.
You now have the bright parts of the contour lines. Unfortunately QGIS does not yet support blending modes for whole groups so you will have to combine this with the next step in a raster graphics tool of your choice. Gimp works fine.
Take a screenshot of something.

Invert hillshade color ramp to white to black.
Rotate your angle by 180 (so it would be 90 instead of 270 in the example above).
You now have the dark lines.
Take another screenshot.
conscalehilmul270 conscalehilmul90
Add both images to a image in Gimp, Color to Alpha with black, invert the dark one, choose nice background, done!

scaled line width

This is still pretty rough as it’s mostly hack after hack and not “done properly”™. The blending adds some shadows where there should not be. In a way the lines end up being same width because of this. The scaling was done arbitrarily, there is probably some smart way with a better scale. Some fancy smoothing of the lines would look great. Coloring the areas between the lines would probably improve it as well. Once QGIS gets support for blending modes of groups, this will be much easier.